What does the move do to my bill and my renewal? And how to move?

Adrian Brudaru
dltHub ships four Migration Blueprints: Python scripts, dlt, Fivetran, and Airbyte to dltHub. LLM-native tooling turns multi-month, senior-only migration projects into weeks of work at a fraction of the cost.

Matthaus Krzykowski
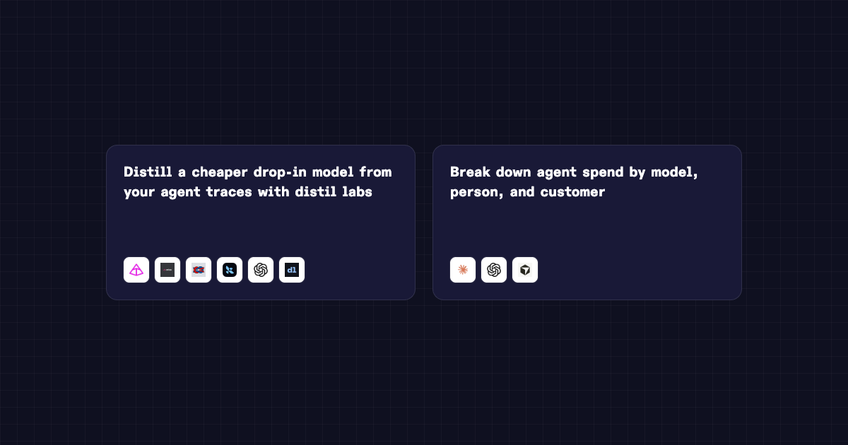
dltHub launches two Blueprints for agent spend: Agent Cost & Usage to break down what each model, person, and customer costs, and Agent Distillation (with distil labs) to replace expensive agents with cheaper specialist models.
Matthaus Krzykowski
Answers to the most common questions about dltHub Blueprints: why we are shipping them, why agent spend is hard to measure, how a Blueprint works, and how to get involved.
Matthaus Krzykowski

Roshni Melwani
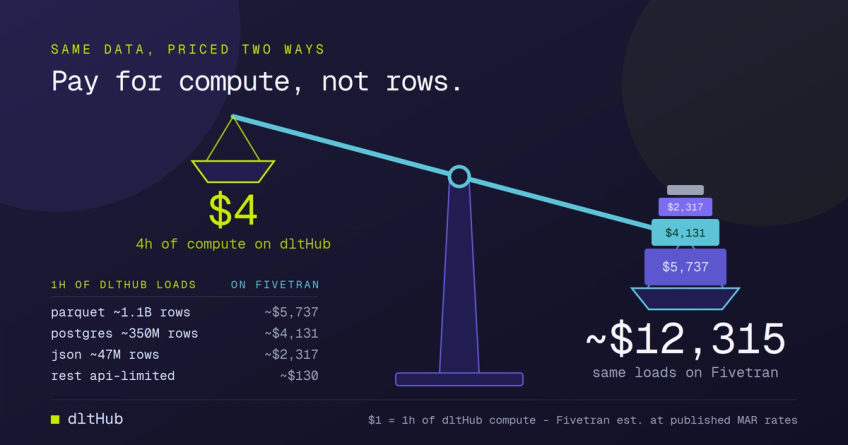
For the last two decades, saas connector companies told you data meant choosing between “build or buy”. Today, agentic building killed that narrative,
Adrian Brudaru
cognee 1.0 is live: open-source memory for AI agents, now self-improving, with a Rust core and single-Postgres deployment. Cognee is a dltHub partner that uses dlt under the hood.
Adrian Brudaru

For years, the thing that held a data pipeline together end to end wasn't a tool. It was you. You were the context layer.
Adrian Brudaru

Agents now write the pipelines, models, and dashboards. What they can't write is what your data means. Meet the data role that's emerging: the semantic engineer.
Adrian Brudaru

Text-to-SQL doesn’t break because models can’t write SQL — it breaks because they don’t know what your data means. Write the meaning down first as a canonical knowledge layer, and use that one spec to both build the model and answer questions over it.
Adrian Brudaru

Schema alone scored 3/10. An ontology scored 10/10. A benchmark across two datasets showing exactly where the gap is, including cases where the model gets the right answer for the wrong reason.
Roshni Melwani
