Query your API’s data with SQL, no data warehouse needed
Want to run SELECT * on your API data without setting up a database? dlt datasets let you query API data using SQL without setting up a database or data warehouse. They follow the Write-Audit-Publish (WAP) pattern, enabling direct SQL queries while keeping workflows efficient.
 Aman Gupta,
Data Engineer
Ever wanted to run a SELECT * on your API data without setting up a database or data warehouse?
Building ETL pipelines from REST APIs involves pagination, schema drift, rate limits, and incremental loading. dlt’s REST API source handles all of these concerns automatically, making data ingestion straightforward.
But what if your goal is even simpler? Do you just want to query or audit data quickly using SQL directly on your filesystem without infrastructure overhead?
Enter dlt datasets
dlt datasets provide direct SQL access to your staged API data without requiring any separate database setup. They follow the Write-Audit-Publish (WAP) pattern, allowing you to:
- Query data directly from a filesystem or cloud storage.
- Interact programmatically using classes like
ReadableDataset(datasets) andReadableRelation(tables). - Move data to other destinations after queries, seamlessly integrating with your data workflows.
Think of dlt datasets as a lazy database: data is only loaded when explicitly queried, making your workflow efficient and straightforward.
Quick demo: Querying GitHub API data using SQL
Reason for notebook: I want to query APIs with SQL. I don’t want to make requests and handle the response and load it somewhere else. Perhaps I don’t even know Python besides some tutorials.
Path taken: I am using a config-based REST API client from dlt + their datasets access that spins up an in-memory db on top of the filesystem when we want to query data.
Result: I can access and review the data using datasets.
Steps:
1. Install dependencies:
!pip install -q dlt[filesystem] dlt[pyiceberg]2. Define and run your pipeline:
import os
import dlt
from dlt.common.pendulum import pendulum
from dlt.sources.rest_api import rest_api_resources

#Create a source
@dlt.source(name="github")
def github_source():
    yield from rest_api_resources({
        "client": {"base_url": "https://api.github.com/repos/dlt-hub/dlt/"},
        "resources": [{
            "name": "issues",
            "endpoint": {
                "path": "issues",
                "params": {
                    "per_page": 100,
                    "state": "all",
                    "since": {
                        "type": "incremental",
                        "cursor_path": "updated_at",
                        "initial_value": pendulum.today().subtract(months=6).to_iso8601_string(),
                    },
                },
            },
            "table_format": "iceberg",
        }],
    })

#Create  a pipeline
pipeline = dlt.pipeline(
    pipeline_name="rest_api_github",
    destination="filesystem",
    dataset_name="rest_api_data",
)
print(pipeline.run(github_source()))
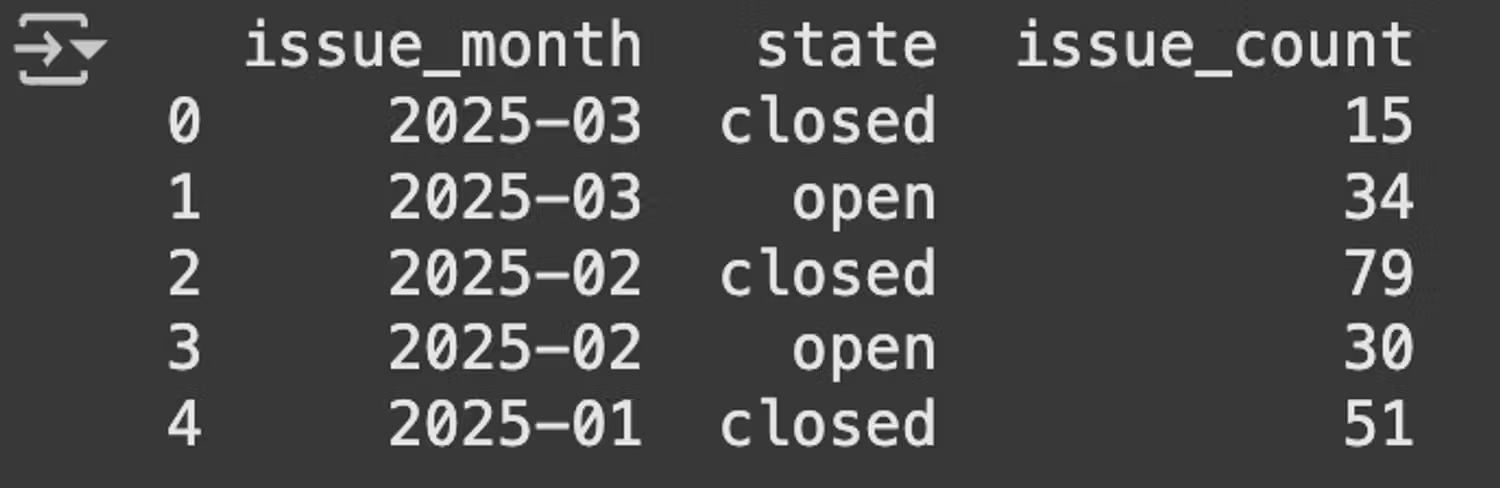
3. Query your data using SQL:
# Retrieve the dataset object from the pipeline
dataset = pipeline.dataset()

# Execute SQL query to aggregate issues by month and state
sql_code = dataset(
    """
    SELECT
        strftime(created_at, '%Y-%m') AS issue_month,
        state,
        COUNT(*) AS issue_count
    FROM issues
    WHERE created_at >= CURRENT_DATE - INTERVAL '6 months'
    GROUP BY 1, 2
    ORDER BY 1 DESC, 2
    """
)

# Display the first few rows of the query result DataFrame
print(sql_code.df().head())
You'll get a summary like this:
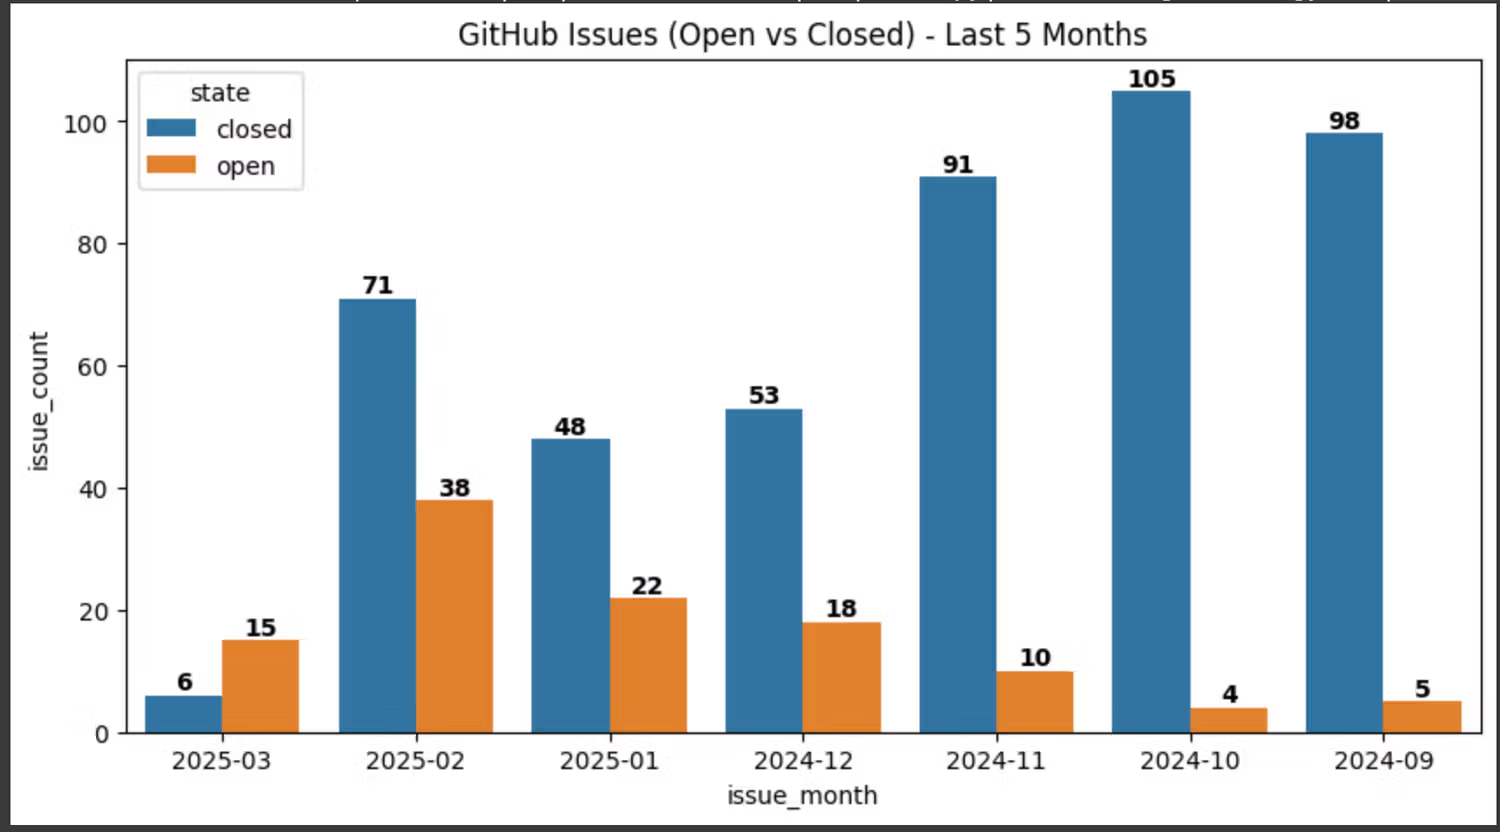
3. Visualize the results (optional):
import matplotlib.pyplot as plt
import seaborn as sns

df = sql_code.df()  # Get the DataFrame

plt.figure(figsize=(10, 5))
ax = sns.barplot(x="issue_month", y="issue_count", hue="state", data=df)

#Add labels on top of each bar
for p in ax.patches:
    height = int(p.get_height())
    if height > 0:  # Only annotate non-zero bars
        ax.annotate(f'{height}',
                    (p.get_x() + p.get_width() / 2, p.get_height()),
                    ha='center', va='bottom', fontsize=10, fontweight='bold')

#plt.xticks(rotation=45)
plt.title("GitHub Issues (Open vs Closed) - Last 5 Months")
plt.show()
Not every situation calls for a cloud warehouse. When simplicity is key, just query your API data directly, no extra infrastructure needed.
Want more?
Try it now! Query APIs in SQL without setting up infrastructure. → Google Colab demo.
Or read more about REST API source and datasets access in our docs