dlt & dbt in Semantic Modelling
 Hiba Jamal,
Junior Data & AI Manager
The Chinese Whisper of Data
In the context of constructing a modern data stack through the development of various modular components for a data pipeline, our attention turns to the centralization of metrics and their definitions.
For the purposes of this demo, we’ll be looking specifically at how dlt and dbt come together to solve the problem of the data flow from data engineer → analytics engineer → data analyst → business user. That’s quite a journey. And just like any game of Chinese whisper, things certainly do get lost in translation.

Taken from the real or fictitious book called '5th grade Data Engineering, 1998'.
To solve this problem, both these tools come together and seamlessly integrate to create everything from data sources to uniform metric definitions, that can be handled centrally, and hence are a big aid to the data democracy practices of your company!
Here’s how a pipeline could look:
- Extract and load with
dlt:dltwill automate data cleaning and normalization leaving you with clean data you can just use. - Create SQL models that simplify sources, if needed. This can include renaming and/or eliminating columns, identifying and setting down key constraints, fixing data types, etc.
- Create and manage central metric definitions with the semantic layer.
1. Extract, Structure, & Load with dlt
The data being used is a questionnaire, which includes questions, the options of those questions, respondents, and responses. This data is contained within a nested JSON object, that we’ll pass as a raw source to dlt to structure, normalize, and dump into a BigQuery destination.
# initializing the dlt pipeline with your data warehouse destination
pipeline = dlt.pipeline(
    pipeline_name="survey_pipeline",
    destination="bigquery",
    dataset_name="questionnaire"
)

# running the pipeline (into a structured model)
# the dataset variable contains unstructured data
pipeline.run(dataset, table_name='survey')
The extract and load steps of an ETL pipeline have been taken care of with these steps. Here’s what the final structure looks like in BigQuery:

questionnaire is a well-structured dataset with a base table, and child tables. The survey__questions and survey_questions__options are normalized tables with, the individual questions and options of those questions, respectively, connected by a foreign key. The same structure is followed by the ..__respondents tables, with survey__respondents__responses as our fact table.
2. Transformation with dbt
For transformation, we head to dbt.
- The tables created by
dltare loaded as sources intodbt, with the same columns and structure as created bydlt. - Since not much change is required to our original data, we can utilize the model creation ability of
dbtto create a metric, whose results can directly be pulled by users.
Say, we would like to find the average age of people by their favorite color. First, we’d create an SQL model to find the age per person. The sources used are presented in the following image:
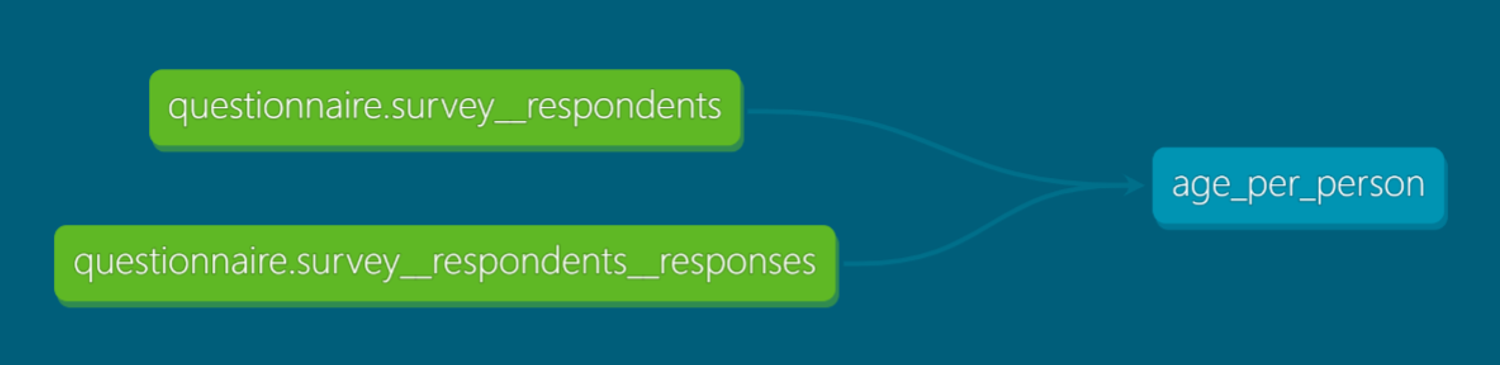
Next, using this information, we can find the average age for each favorite color. The sources used are as follows:

This is one method of centralizing a metric definition or formula, that you create a model out of it for people to directly pull into their reports.
3. Central Metric Definitions & Semantic Modelling with dbt
The other method of creating a metric definition, powered by MetricFlow, is the dbt semantic layer. Using MetricFlow we define our metrics in YAML files and then directly query them from any different reporting tool. Hence, ensuring that no one gets a different result when they are trying to query company metrics and defining formulas and filters for themselves. For example, we created a semantic model named questionnaire, defining different entities, dimensions, and measures. Like as follows:
model: ref('fact_table') # where the columns referred in this model will be taken from
# possible joining key columns
entities:
  - name: id
    type: primary
# where in SQL you would: create the aggregation column
measures:
  - name: surveys_total
    description: The total surveys for each --dimension.
    agg: count
    # if all rows need to be counted then expr = 1
    expr: 1
# where in SQL you would: group by columns
dimensions:
  # default dbt requirement
  - name: surveyed_at
    type: time
    type_params:
        time_granularity: day
  # count entry per answer
  - name: people_per_color
    type: categorical
    expr: answer
  # count entry per question
  - name: question
    type: categorical
    expr: question
Next, a metric is created from it:
metrics:
  - name: favorite_color
    description: Number of people with favorite colors.
    type: simple
    label: Favorite Colors
    type_params:
        # reference of the measure created in the semantic model
      measure: surveys_total
    filter: | # adding a filter on the "question" column for asking about favorite color
       {{  Dimension('id__question') }} = 'What is your favorite color?'
We can now query this query, using whichever dimension we want. For example, here is a sample query: dbt sl query --metrics favorite_color --group-by id__people_per_color
The result of which is:

And just like that, the confusion of multiple people querying or pulling from different sources and different definitions get resolved. With aliases for different dimensions, the question of which column and table to pull from can be hidden - it adds a necessary level of abstraction for the average business end user.