Somewhere Between Data Democracy and Data Anarchy ⚔️
 Hiba Jamal,
Junior Data & AI Manager
Data democracy is a beautiful thing. People are more empowered, less dependent and unblocked in terms of data curiosity. dlt has served this mission by allowing users to create data pipelines from anywhere - or rather, anywhere that Python runs.
However, what breaks this utopic dream is when big curious ideas, several undocumented pipelines (with perhaps with the same data) and conflicting dashboards cause confusion and indecision. This is not to say that data democracy is a bad thing, or that people shouldn’t have freedom to be curious, but it does paint a picture of an organization riddled with anarchy.

It surely can turn into a curse when there are no procedures or rules to limit the creation and modification of data. Here are some consequences of too much freedom of creation and modification of data:
- Incorrect (unvalidated) or redundant data
- Multiple sources of truth
- Conflicting dashboards and decisions
- Clutter in data warehouse
- Extra storage space that you may have to pay for
- Longer waiting times to get simple data
- Higher workload on data team
- Repetitive meetings to find correct data sources
- Repetitive meetings to validate data extracts
So, how do we solve for the issue of anarchy?
While there is no short path to resolution in these disturbing state of affairs, one path to strive for is governed data democracy. To reach a state of good governance, procedures, rules, and permissions need to be put into place.
There are some incredible tools that help us achieve this, from creating permission profiles or enforcing rules, down to schema level contracts. We are working on a lot of new features for data governance in dlt+, including more fine-grained data contracts and data access profiles. Join the waiting list to learn more!
However, it is up to the data team itself to make use of those capabilities, and also to create a space for everyone to be able to explore to the data independently. Because even though this article is primarily about laying down the law of the data land, citizens of this land must feel comfortable exploring and creating data sources. This also includes creating procedures for recovery & backup.
Possible steps to take
To illustrate how to get to such a position, here’s a step by step of what we did at dlt for our team. To start with, this is our data stack: data is injected with dlt to BigQuery from various sources and is explored in Metabase through figures and dashboards.
Step 1: Identify Main Data Sources & Document
Given that various datasets have been created by different individuals to meet specific data needs, it's important to identify which of these datasets (if any at all) are important, accurate and already in use (in reports or dashboards). These datasets must also be documented clearly. For instance, we have data from:
- Google Analytics (analyzing website traffic)
- GitHub (to track stargazers and contributors)
- Slack (to monitor how well we’re supporting our community)
Over time, the presence of multiple datasets containing overlapping information has made it challenging for users to determine which dataset to rely on for analytics or reporting. To address this, we first identified when and by whom these data pipelines were created. Based on this, unnecessary pipelines were disabled to ensure that each data source has a single source of truth. The redundant datasets were either deleted or migrated to a separate data environment, which will be discussed in Step 2.
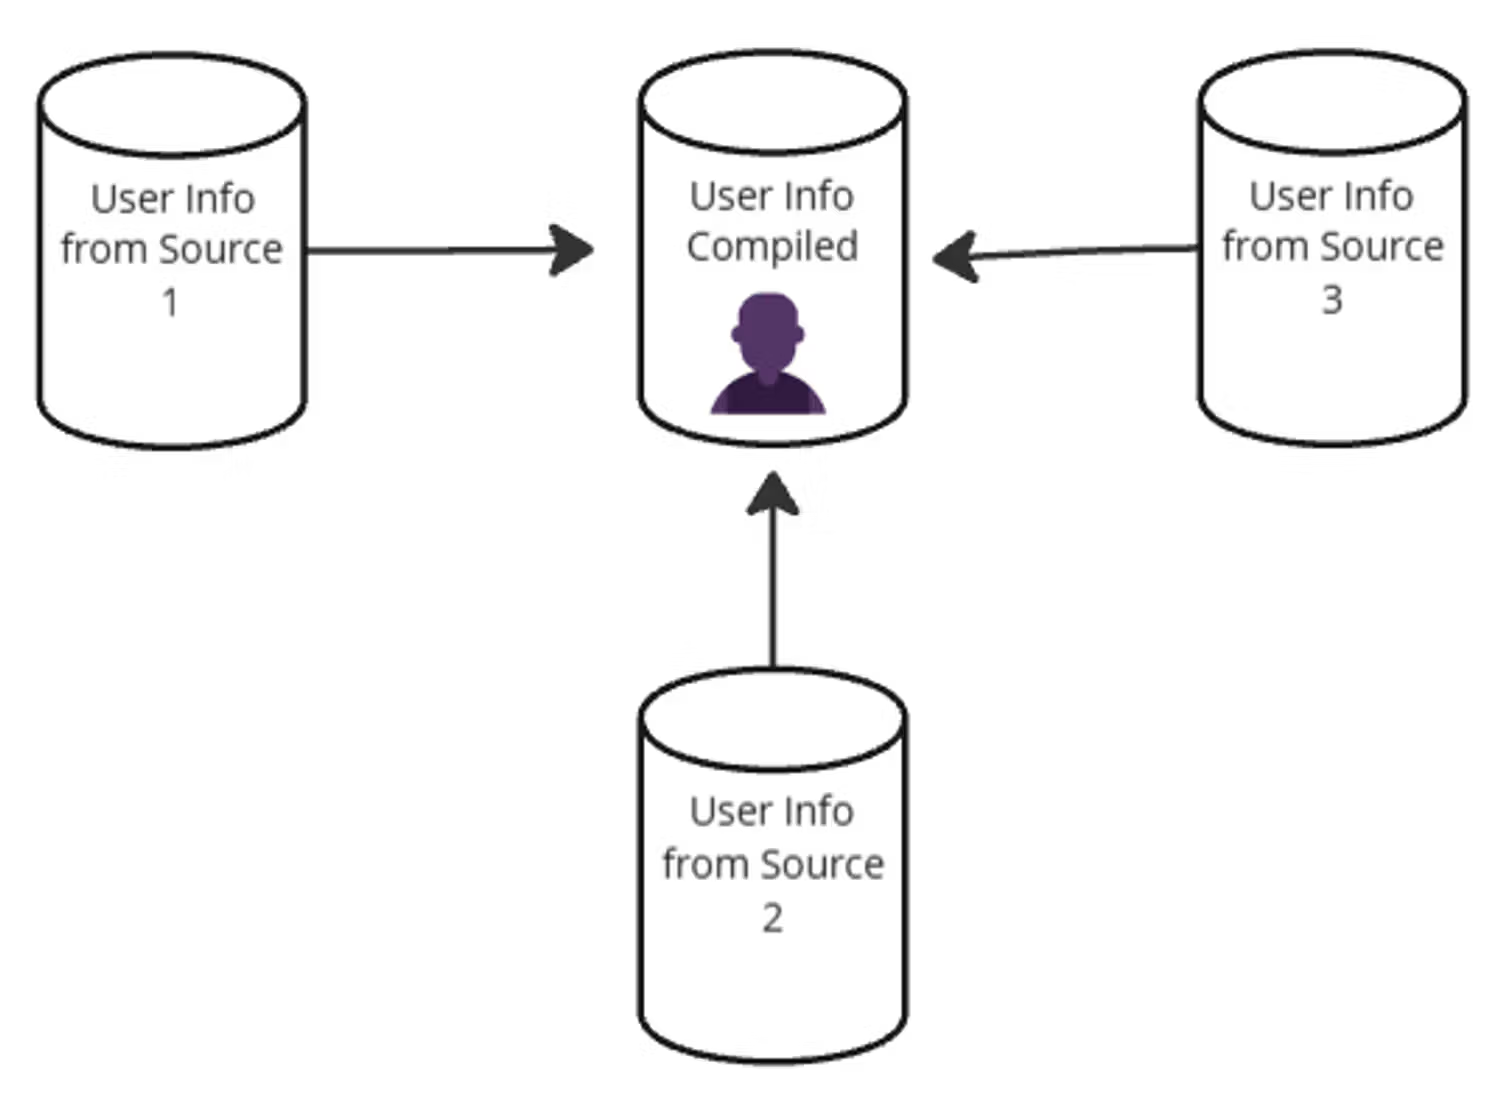
If in any case, data sources need to be modeled into a single dataset as a single source of truth (shown below), those cases were identified too. dbt is a great tool to handle such scenarios. And - at the risk of sounding like a broken record at this point, document such models too!

While the documentation doesn’t need to be overly detailed, providing clarity on the designated single source of truth for each data source can significantly reduce confusion and improve data reliability.
Step 2: Host all pipelines in shared repositories
dlt enables Pythonic data pipelines which are compatible with different orchestrators and composers. However, with the possibility of such flexibility may also come anarchy. For example, in our team, this looks like having some pipelines automated on GitHub actions, some on airflow, and some as google cloud functions invoked from perhaps a third place.
Needless to say it took quite a few meetings to crack the previous step. Since different data sources were created by different data pipelines. This process could be alleviated if there was a known location(s) to go to, to see all the pipelines hosted there. In addition to this knowledge sharing, a shared repository can have a review process. This would ensure that no faulty pipelines are created and are adding data to your production warehouse.
Step 3: A Test and Production Data Environment
Just as with software development goes, there is a development environment and a production environment. Nothing gets pushed into production unless it goes through the development environment, and no experimentations are conducted in the production environment either. We apply the same concept to data!
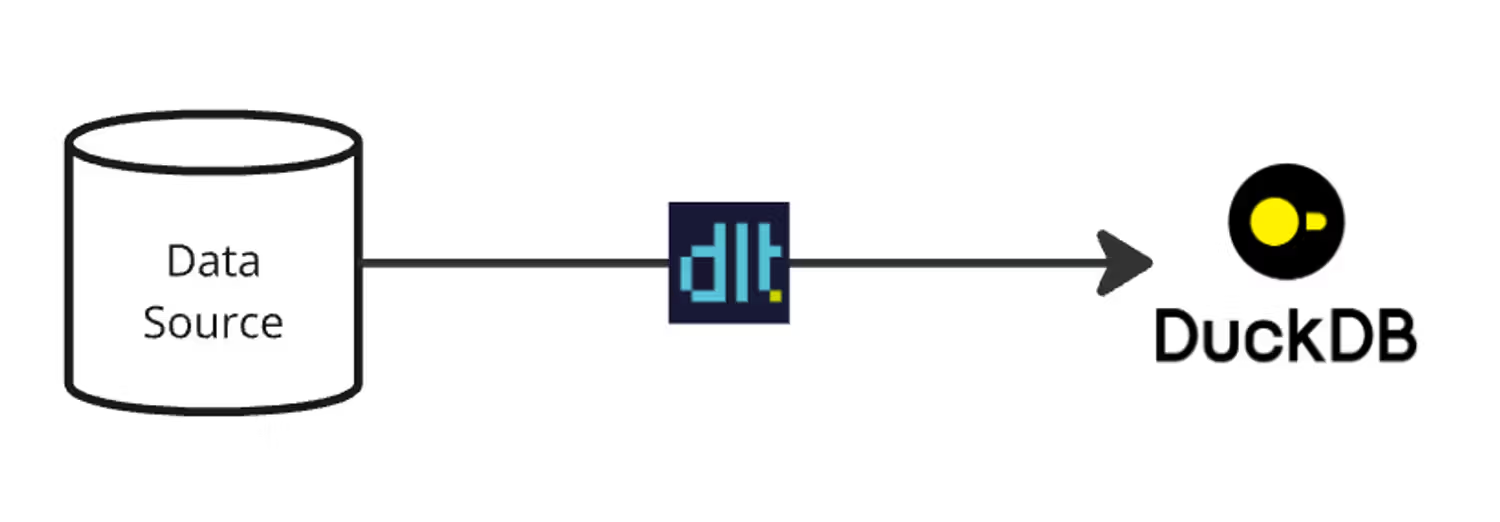
Most of the team uses duckdb for locally testing a pipeline before “pushing it to production” or simply pushing it to BigQuery. However, many experiments are conducted that need to be shared, so many experimental or redundant datasets can exist in BigQuery as well.

To enable the entire team to freely experiment with dlt—creating and using as many datasets as needed—we set up a dedicated test data environment. In BigQuery, this involved creating two separate projects: the primary project and a test project, which we refer to as the sandbox. The sandbox project has more relaxed permissions, allowing team members to delete datasets. Additionally, the service account credentials for this project have fewer restrictions, providing greater flexibility to read and write data.

Properly using these environments is one of the most repeated instructions to the team. It is important to remind people to not choose violence 😈 and add things directly to the production environment, to not further confuse other people on the single sources of truth. Lastly, to keep this environment as clean as possible, a workflow can be created to delete these experimental datasets. This workflow can delete datasets after a certain window of time has passed after creation. This is done by deleting datasets with a “…_test” suffix. This means another rule for the team to follow :).
Step 3.1: Create an automated data transfer service between both environments
To maintain a clean production environment, there should be a service that allows for the transfer of test datasets from the production environment to the test environment when necessary. Similarly, if a dataset in the test environment becomes important and needs to be moved to the production environment, a service should be available to facilitate this transfer seamlessly.
In BigQuery, we addressed this need by creating a cloud function. This function takes the datasets to be transferred as input and can be executed directly from the console, ensuring easy & efficient movement of datasets between environments.
Another way of tackling this problem is creating a dlt pipeline that moves data from the source project to the destination project - given that both have their own credentials, and that can be handled in dlt!
Disclaimer - it is important to note that a service like this that securely transfers data may be more fit for startups. In larger corporations, in order to maintain data privacy (like for PII), this may not be an option.
Step 4: Create A Backup Policy & Document
To ensure that people retain flexibility and freedom, even within the framework of rules and procedures—including the freedom to make mistakes—backup policies should be implemented and clearly documented. Fortunately, BigQuery provides a default seven-day time travel window, allowing data to be retrieved within that period using SQL queries or through the console. This functionality required minimal effort to set up, it is the backup policy identified and documented for the team’s reference.
Step 5: Document How To Access Data And When To Use Which Tool
Now that you've told people what to use (by identifying the right sources), you need to tell them how to use it. This means identifying your team's use cases and providing answers accordingly. This can be highly subjective.
For us it meant the following (this is a snippet from our data documentation):
Should I use BigQuery or Metabase?
- If you need to simply look at some data and not share it forward, then simply query BigQuery datasets via SQL and look at them yourself.
- If you need to share a certain query result as a google sheet, then once the query is executed on BigQuery, click on “Open In” > “Sheets”.
- If you want to create a report/visualisation/dashboard, then go to Metabase. However, either add them to an existing collection or create a new one, since it’s very easy to lose visibility on things you create in Metabase. If you don’t understand where to add them, you can add them to your own personal collection.
- If you want to use this data in some service, like a slack bot, then use the Python client for BigQuery.
Other rules to follow according to those use cases:
- If you are creating a new pipeline, please be aware that there is a test/experiment project (
dlthub-sandbox) and a production environment/project (dlthub-analytics). If it is a pipeline that is simply a test or experiment that you will not be using for more than a few weeks for a project, please create it using credentials for sandbox. - If you want to create a table/view using existing data, please do so in Metabase. You can create Metabase models that everyone can use! 🎉
- If you want to create figures and tables, or ask questions from the data (to perhaps track that certain question’s results, like slack response rate), please do so in Metabase.
- Anytime you create something on Metabase, try to add a description.
Parting thoughts ✍🏻
So, in this land of the free data users and home of the free data creators, we have established that procedures and data governance processes are key to maintaining data democracy.
Safe to say that the best place to start when it comes to data governance and democracy is documentation of things just as they are. Doing so would create an initial knowledge base. This documentation would first empower people to use data since they would know where to look or what to use. Secondly, it would provide a good foundation to have informed discussions on, which come while figuring out which data democracy practices your teams should abide by.
Lastly, taking inspiration from elements of software engineering like code/PR reviews, the creation of dev and prod environments, seems to be a pretty important element to maintaining stability of your storage and analytics infrastructure. Tools exist to serve our needs, but we need to be able to effectively use them!
Wish you all an empowered data-curious, self-serving team!