What is so smart about smart dashboarding tools?
 Hiba Jamal,
Junior Data & AI Manager
The advent of ChatGPT...
...sparked widespread speculation about the future of many professions, analytics included. Now, over a year later, and with an array of GPT and LLM-powered analytics tools at our disposal, we're in a stronger position to assess their intelligence and capabilities.
In this article, we explore ThoughtSpot, known for its simplicity and strong data democracy practices. However, our focus narrows to Sage, its LLM assistant, and examining how it can empower or replace analytics techniques carried out by different analysts.
Analysts: Fallen victims of AI or not?
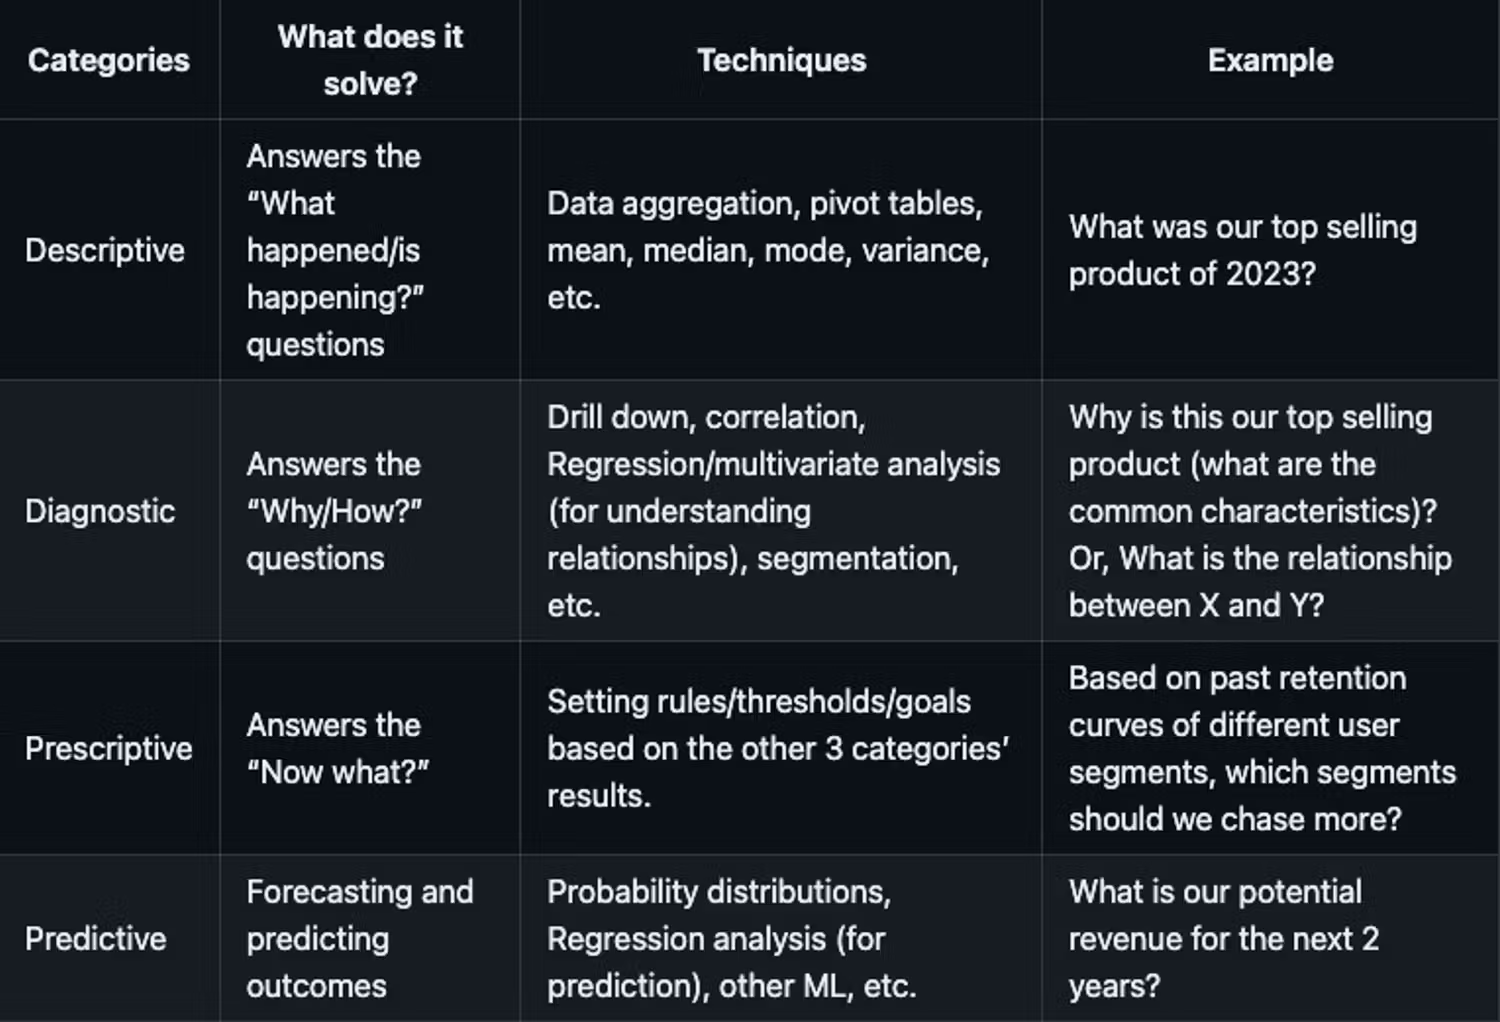
The data analyst's role encompasses various job descriptions – from data science to dashboarding, data pipeline management, and even ML engineering. However, for this blog, we'll focus on the four key analytics components or techniques that help a company achieve its goals, as outlined by Gartner.
Gartner’s categories:
There have been solutions around utilizing LLMs to solve these analytics strategies, some of these attempts can be found on opensource sources and others as commercial products.
For example, Mariya Mansurova at Wise created a GPT driven LLM agent that can do descriptive analytics and other reporting tasks.
Other commercially existing solutions include:
- ThoughtSpot’s Sage AI, an LLM analyst you can ask questions to about your data in simple language.
- Pecan.ai, which creates predictive models based on cases described in simple language.
- SnapLogic, which designs data workflows based on reporting needs through its generative integration capabilities.
ThoughtSpot’s Sage is powered by GPT - and as easy as GPT has made our lives, every GPT or any LLM user understands the importance of engineering a prompt good enough to actually get the answer one wants from the LLM. This might be a challenge open to AI driven analytics tools on how they cater to different types of users; for example, a business user can ask the same question differently than an analyst.
In this article, we've chosen ThoughtSpot's Sage as our emblem for AI-driven analytics. We'll assess its performance across various analytics scenarios, aligned with the four categories previously defined. Our discussion will explore whether AI, through Sage, serves to replace or enhance analysts these analytics domains. The style of questions we will ask Sage will be a mix of what can be posed in the language of a business user and an analyst.
The data & data model
The data that’ll be used for this experiment will be from the HubSpot CRM, regarding various deals, companies and contacts and different stages of their journey. This data was populated and then pulled via the HubSpot API in Python and then loaded into BigQuery via dlt. The data was structured into different tables by dlt and final model looks as follows:
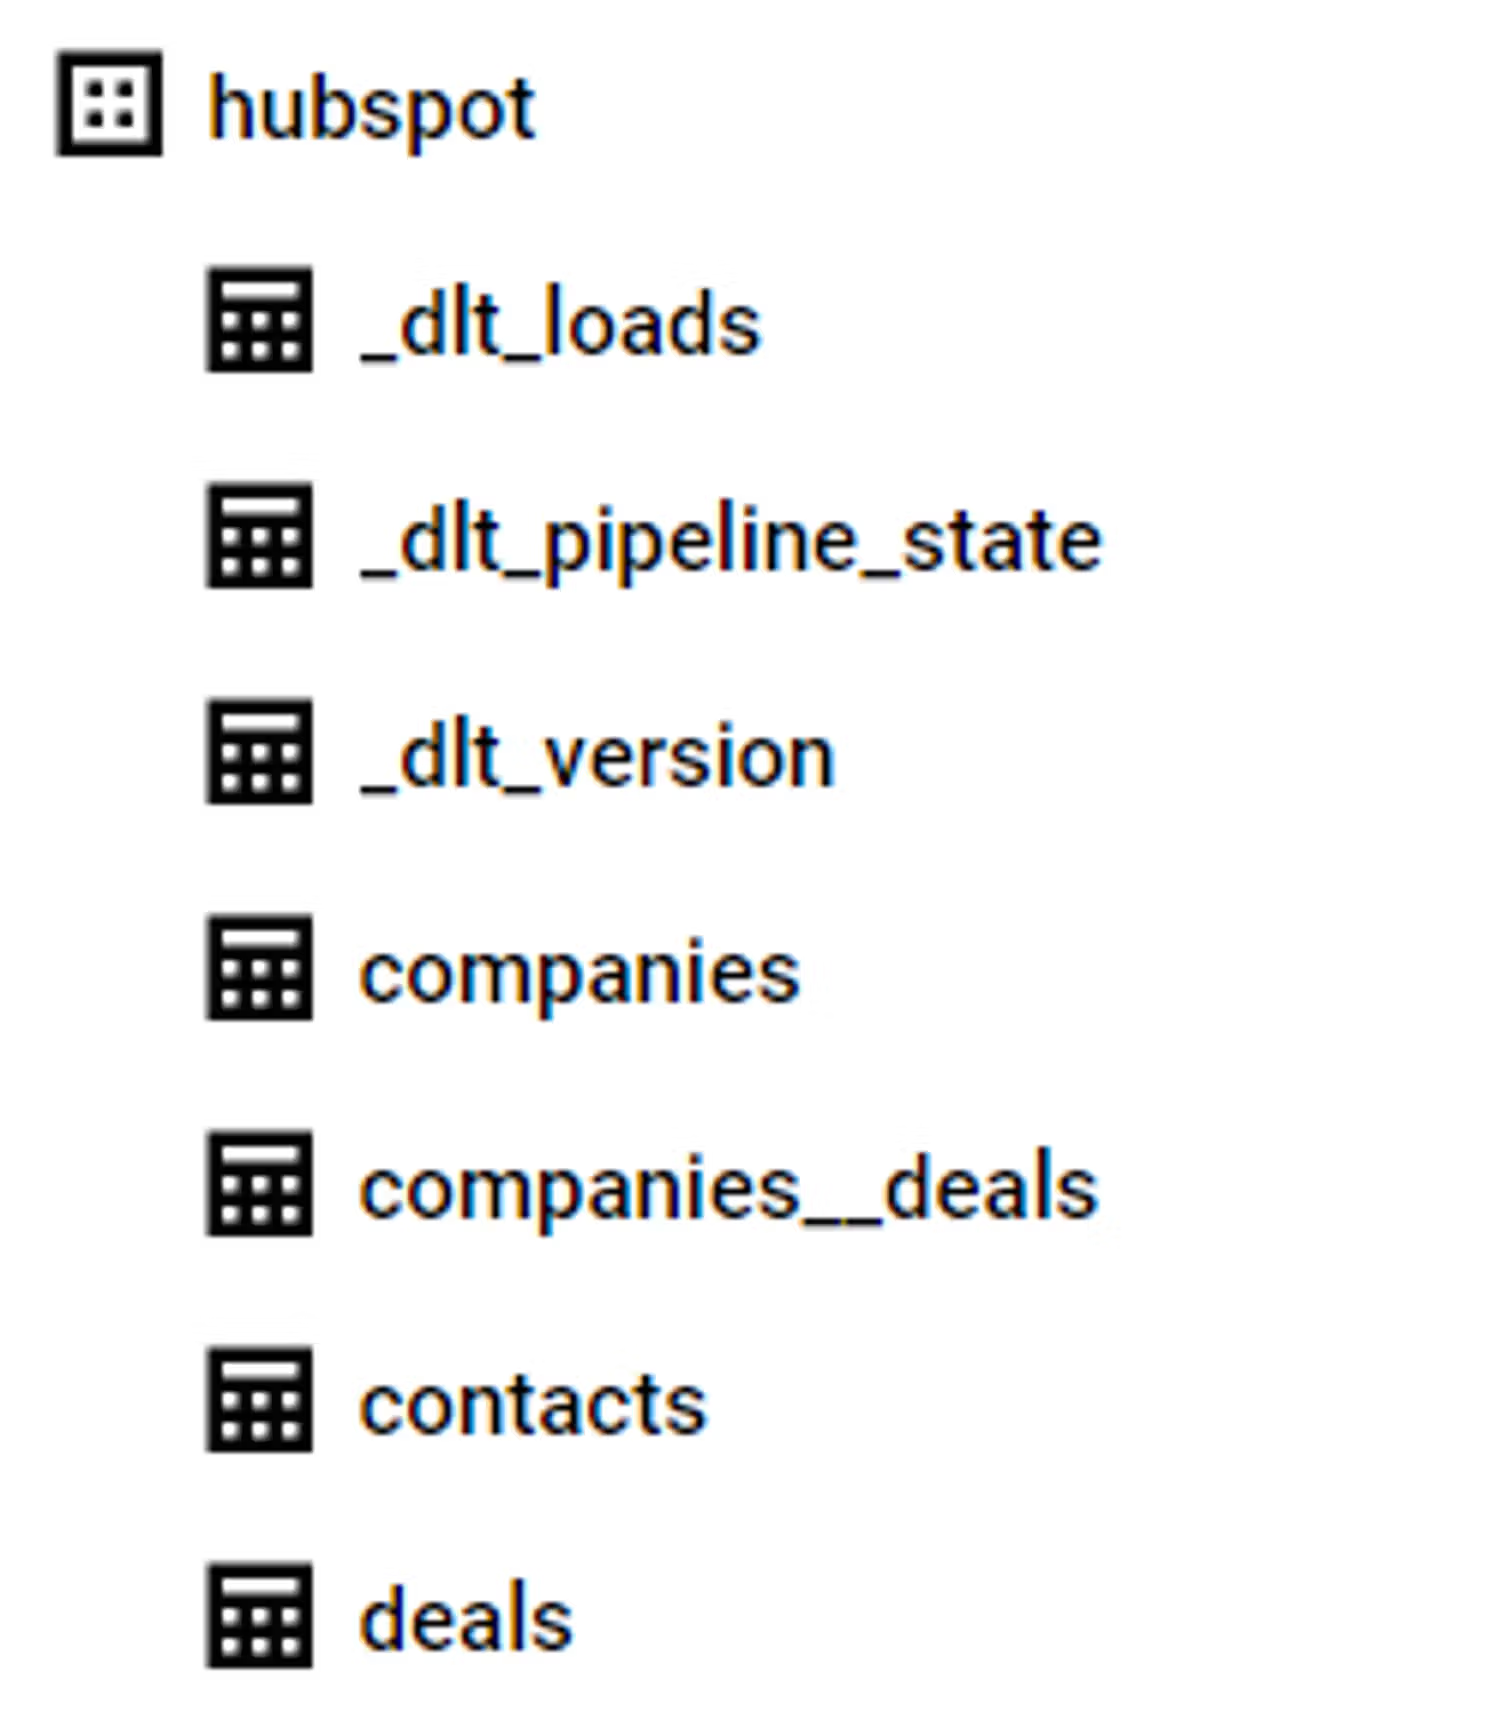
It is important to note how the child table, companies__deals show the association between the deals and companies tables. In other words, it shows which deal exists in the pipeline for which company. This model will be useful while trying to do some diagnostic analysis of different deals.
Evaluating Sage AI
Before diving in, it's important to note that ThoughtSpot can connect to dbt's semantic layer, which helps contextualize the questions asked - for example, by making clear what a certain success metric might mean. However, we haven't set up any semantic definitions or pre-built dashboards for this data. Our analysis will solely rely on raw data modeled by dlt. This approach might limit our ability to fully showcase ThoughtSpot's capabilities and the potential of combining AI in analytics with semantic modeling. Nonetheless, our focus here is on evaluating Sage AI's inference capabilities with raw data, across all categories except for prescriptive analytics, which leans more towards strategic business decision-making.
The lack of semantic definitions and other dashboards meant that for each question asked to Sage, we had to specify exactly which table it should look into, to find a result. For example:

Let’s begin asking questions and see how Sage answers! The framing of each question is exactly as it was asked to Sage.
Descriptive Analytics
- How many companies do we have? ✅
- How many companies do we serve? ✅
- How many deals do we have by month? ✅
- Deals broken by industry, shown as percentages ❌
- Revenue of a deal by stage ❌ Proportion of each deal stage’s revenue ❌
- What percentage of companies is in the computer software industry? ✅
- Show revenue by month ✅ Worked even though the revenue column is named “amount” - it could infer!
- How many deals are signed by each company? ✅This was by far the most astounding result! The underlying model is
companies__deals, and it contains the unnested information for what deals belong to which company. The schema looks like this:

a. Unnested means that there is a parent table, which here is companies, and a child table, which here is deals. A company can have several deals.
b. The _dlt_parent_id then refers to a company id, saved in the companies table. This is a dlt assigned primary key to a company. Whereas, the value field is a HubSpot defined primary key to a company. Both saved as foreign keys in this table.
c. The deals_id is also therefore present in the deals table.
d. Whereas, _dlt_list_idx is another column to keep track of rows during the process of unnesting - courtesy of dlt. Perhaps given the naming convention of the table; companies__deals, and the word parent in the columns, Sage was able to infer the connection between the two. Here is the result:

- To extend this result to include company names, I added joins in the ThoughtSpot data model as allowed by the tool, but it still did not seem to make a difference when it came to replacing the foreign keys with names of the companies. Nonetheless, the child table that
dltput into place still served its purpose for Sage to understand what it is, and that is a remarkable feat for both the tools! - Best deals ✅
- Showed by revenue/amount in descending order.
- Least successful industry? ✅
- Showed by deals lost. Solving this question by using the status of deals (won/lost), rather than the revenue, as in the last prompt, shows the versatility of Sage and its understanding of data models.
Summary: Worked impressively well on the different types of questions asked, unless speaking on proportions.
Diagnostic Analytics
- What are the shared characteristics of top 5 deals? ❌ - it tried by showing all columns of 5 highest amounts.
- Drill through most successful deals ✅ - showed characteristics of most successful deals by revenue, and success of deal closing.
- What do the most successful deals have in common? ❌ - showed individual deal information as above.
- Cluster deals ❌ - showed all data.
- Segment deals ❌ - showed all data.
- Cluster deals by amount and industry ❌ - showed a useful graph between the two columns but no grouping.
- Relationship between amounts in closed-won and closed-lost ❌
- Regression with closed-won and closed-lost ❌
Summary: Does not work fairly well, will not work at all for business users. The area in ThoughtSpot where queries can be crafted with AI will answer most of these questions, but this tool would more so empower analysts than business users.
Predictive Analytics
- Probability of closing deals ❌ - showed by industry (however, it is a simple probability calculation, not a future prediction).
- Probability of closing deals in 2024/in the future/in the next 3 months ❌
- Predict/estimate/forecast revenue for 2024 ❌
- If we keep acquiring deals at the same rate as historical, how many will we have in 2024? ❌
Summary: Works well for probabilities but not predictions - but that was a bit of a stretch anyway, it would be something that would fall into the Forte of Pecan.ai. Sage instead relied on probability and aggregate values for existing data (filtered on future dates, like 2024).
Scores
The summary of our findings was quite predictable: Sage excelled at answering descriptive analytics questions more so than in diagnostic or predictive contexts. Its performance in interpreting descriptive queries was notably impressive.
The score:
- Descriptive analytics: 6/8 (75%)
- Diagnostic Analytics: 1/8 (12.5%)
- Predictive Analytics: 0/4 (0%)
Conclusion
Regarding the debate on whether smart dashboarding or AI driven analytics tools could displace analysts, it appears that for basic descriptive tasks, especially when combined with semantic data definitions, analysts could potentially be replaced. This ties back to how much clarity in context is given to LLMs.
The importance of a solid data model was highlighted, proving essential for an LLM like Sage to accurately understand or deduce business user needs. However, when it comes to diagnostic tasks, AI in LLMs still has progress to make before they can fully replace analysts. Instead, they are more likely to empower analysts by offering solutions via interfaces like ChatGPT and handling descriptive tasks to save time.
In translating this to an analysts toolkit of capabilities, Sage worked well in instances where single simple SQL statements can be executed. This excludes the usage of calculations that can be made to work on window functions and other partition statements in SQL. Whereas, joins have to be specified in the data model if the data is to be pulled from multiple tables. From these SQL statements, Sage was able to construct good visualizations as well.
However, where the metrics or calculations surpassed the complexity of simple SQL statements to Python scripts, LLMs like ChatGPT can be used for script generation purposes. Since, as it stands today, GPT is better at writing code to calculate residuals or function coefficients than actually calculating these things itself.