Using the Google Sheets `dlt` pipeline in analytics and ML workflows
 Rahul Joshi,
Jr. Solutions Engineer
Why we need a simple Google Sheets -> data warehouse pipeline
Spreadsheets are great. They are really simple to use and offer a lot of functionality to query, explore, manipulate, import/export data. Their wide availability and ease of sharing also make them great tools for collaboration. But they have limitations and cannot be used for storage and processing of large-scale complex data. Most organizational data is actually stored in data warehouses and not spreadsheets.
However, because of the easy set up and intuitive workflow, Google Sheets are still used by many people to track and analyze smaller datasets. But even this data often needs to be combined with the rest of the organizational data in the data warehouse for reasons like analytics, reporting etc. This is not a problem when the dataset is small and static and just needs to be exported once to the data warehouse. In most cases, however, the Google Sheets data is not static and is updated regularly, thus creating a need for an ETL pipeline, and thereby complicating an otherwise simple and intuitive workflow.
Since dlt has a Google Sheets pipeline that is very easy to set up and deploy, we decided to write a blog to demonstrate how some very common use-cases of Google Sheets can be enchanced by inserting this dlt pipeline into the process.
Use-case #1: Google sheets pipeline for measuring marketing campaign ROI
As an example of such a use-case, consider this very common scenario: You're the marketing team of a company that regularly launches social media campaigns. You track some of the information such as campaign costs in Google Sheets, whereas all of the other related data such as views, sign-ups, clicks, conversions, revenue etc. is stored in the marketing data warehouse. To optimize your marketing strategy, you decide to build a dashboard to measure the ROI for the campaigns across different channels. Hence, you would like to have all your data in one place to easily be able to connect your reporting tool to it.
To demonstrate this process, we created some sample data where we stored costs related to some campaigns in a Google Sheet and and the rest of the related data in BigQuery.


We then used the dlt google sheets pipeline by following these simple steps to load the Google Sheets data into BigQuery.


Use-case #2: Evaluating the performance of your ML product using google sheets pipeline
Another use-case for Google Sheets that we've come across frequently is to store annotated training data for building machine learning (ML) products. This process usually involves a human first manually doing the annotation and creating the training set in Google Sheets. Once there is sufficient data, the next step is to train and deploy the ML model. After the ML model is ready and deployed, the final step would be to create a workflow to measure its performance. Which, depending on the data and product, might involve combining the manually annotated Google Sheets data with the product usage data that is typically stored in some data warehouse
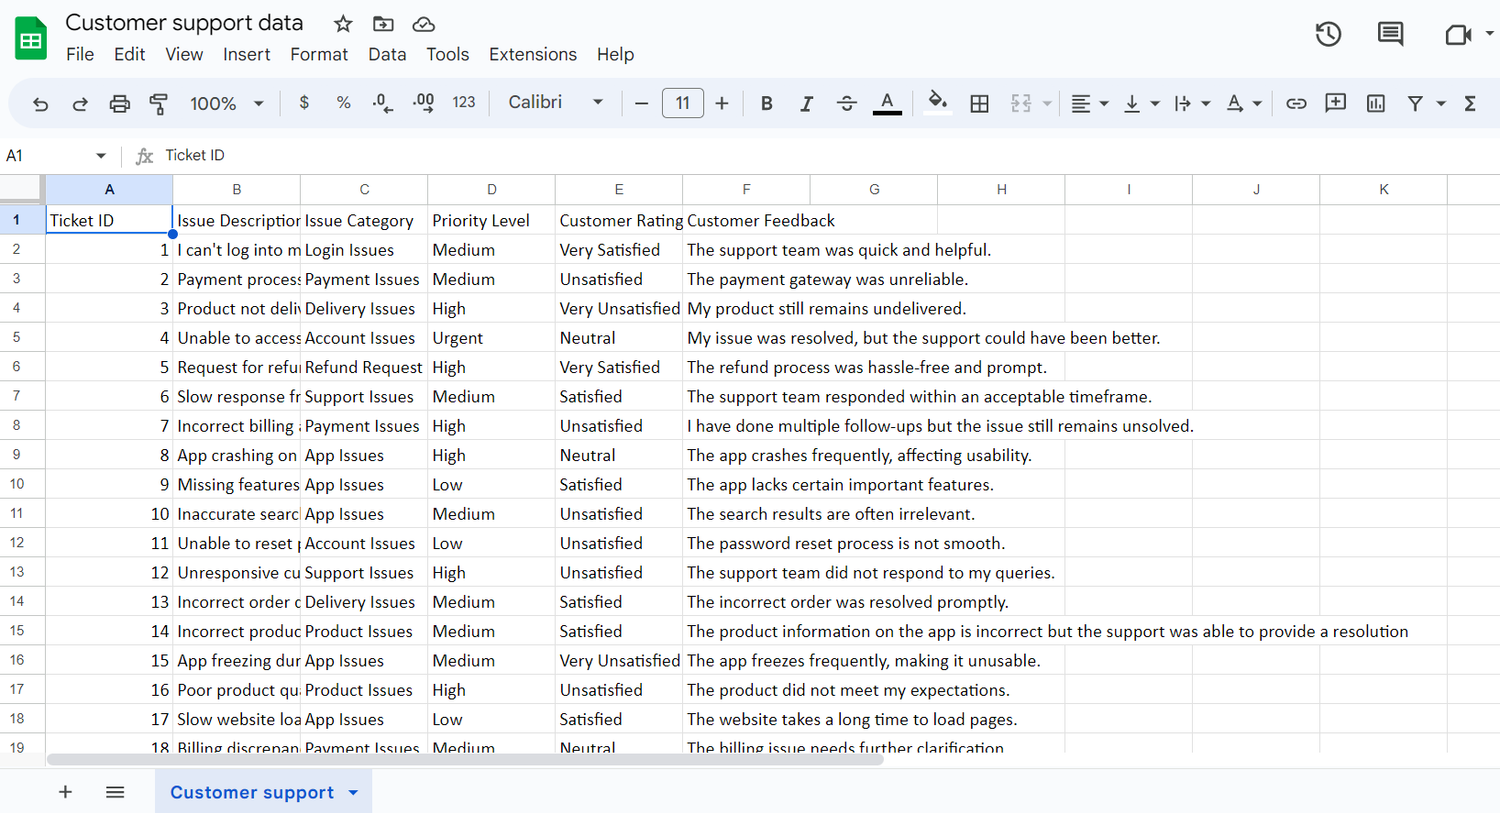
A very common example for such a workflow is with customer support platforms that use text classfication models to categorize incoming customer support tickets into different issue categories for an efficient routing and resolution of the tickets. To illustrate this example, we created a Google Sheet with issues manually annotated with a category. We also included other manually annotated features that might help measure the effectiveness of the platform, such as priority level for the tickets and customer feedback.

We then populated a BigQuery dataset with potential product usage data, such as: the status of the ticket (open or closed), response and resolution times, whether the ticket was escalated etc.

Then, as before, we loaded the google sheets data to the data warehouse using the dlt google sheets pipeline and following these steps.
Finally we connected Metabase to it and built a dashboard measuring the performance of the model over the period of a month:
