Introducing dltHub background agents: verified and custom agents to keep your pipelines healthy
dltHub background agents are in public preview, starting with job-inspector: a verified agent that diagnoses failed pipeline jobs with read-only access and posts the cause, the evidence, its confidence and a recommendation to fix to Slack.

Elisabeth Reitmayr
Director of Engineering
8 min read
On this page
- The state of pipeline maintenance in the agent era
- The diagnosis is the first step in a longer autonomy plan
- What a verified background agent is, and why it starts read-only
- The guardrails are codified in code and configuration
- dltHub background agents run on the primitives you already use
- How to get started
- Frequently asked questions
There's a pattern in manufacturing that operations experts call a migrating bottleneck. You automate the slowest step on the line, output per worker jumps, and the constraint moves somewhere you weren't looking.
Data engineering is living through its own version. Since we shipped the dltHub AI harness, a single engineer builds three times as many pipelines as before, and a pipeline that used to take a week takes a coding agent an afternoon. The time saved building now goes into keeping those pipelines running in production, because every schema change, expired token and upstream issue still lands on one of your engineers.
At dozens or hundreds of pipelines, that means alerts firing constantly. Debugging starts with piecing together clues across multiple systems, and your fastest builders spend their week in incident triage instead of on the work you hired them for.
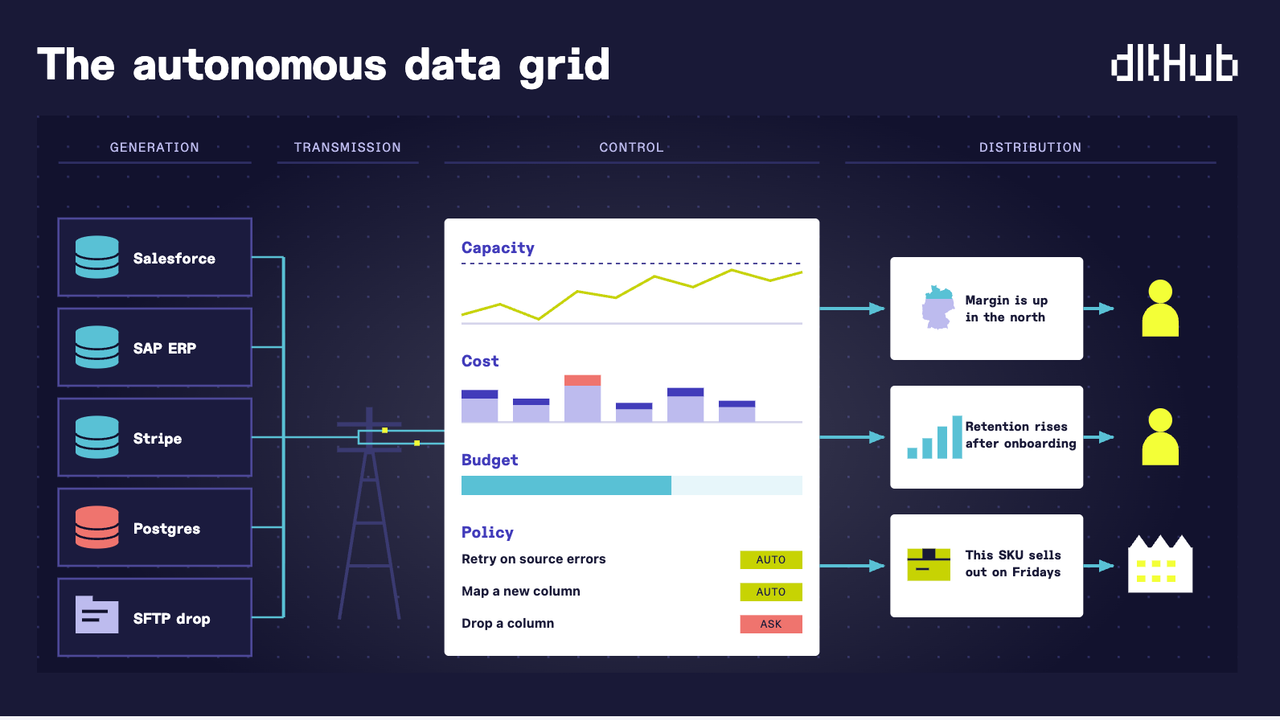
That's the gap dltHub is closing today. dltHub background agents are now in public preview, starting with job-inspector, the first verified agent on the platform built as your companion working in the background and diagnosing the health of your pipelines. When a pipeline job fails, job-inspector reads the run, the logs and the job definition, classifies the root cause, states its confidence, and posts the evidence to Slack in a few minutes.
The state of pipeline maintenance in the agent era
Look at where AI sits on a data team today and the bottleneck becomes clear.
A May 2026 study tracked roughly 3,200 changes to AI-generated files across 100 GitHub repositories and found that humans still performed the large majority of their maintenance. The study shows where the handoff stops: agents generate an artifact, and engineers remain responsible for it after deployment.
Diagnosis, approval, and controlled remediation remain scattered across vendor platforms, observability tools, and incident systems. An agent can help scaffold a pipeline in the morning, yet an on-call engineer still has to reconstruct the failure from logs if it fails at 2am. The obvious next step is to dispatch an agent to investigate failures.
Before an agent investigates a failed production job, the team needs to control what it can access. The platform should define which jobs and data the agent can read, whether it can write, how many turns and tokens it can use, and where the team can inspect those rules. Those limits need to live in configuration or code, because a prompt cannot enforce them.
dltHub background agents start with the part of that work a team can delegate under read-only access.
The diagnosis is the first step in a longer autonomy plan
We don’t think the first step is to give the agent autonomous access to writing to production to fix pipelines. We first give the agent a narrow job with a set of permissions. The agent needs to prove itself to earn the next job with its respective permissions and access.
dltHub's autonomy ladder describes that progression from agents that help build pipelines (level 1) to agents that diagnose failures (level 2), propose fixes for approval (level 3), and eventually autonomously apply narrowly scoped fixes with a track record behind them (level 4).
Background agents advance the diagnosis step and put dltHub at level 2.
Today's release also comes with the first version of a self-improvement loop. Each job-inspector run writes its diagnosis, the run it acted on, the fix once an engineer applies one, and what the run cost back to the dltHub Context Graph, the platform's record of jobs and agent activity. An evaluation agent can score the diagnosis against what actually happened in the pipeline. If it identifies a performance issue, it suggests improvements to the job-inspector agent to better handle similar failures. The next diagnosis starts from more relevant context than the last.
As that record builds, it gives teams the evidence to decide which recurring problems deserve a supervised proposal and, later, a pre-approved repair. When the same incident recurs, the diagnosis is already on file and the cost of handling it drops. The third schema change of a type costs a fraction of the first.
Next on the roadmap are a data quality diagnosis agent and proposed fixes that wait for your approval, and a performance optimization agent that identifies opportunties to speed up pipeliens and make them run more cost-efficiently.
What a verified background agent is, and why it starts read-only
dltHub does this with verified agents, starting with job-inspector.
A verified agent is trained and evaluated on hundreds of production failures. It ships with strict guardrails, including an allowlist for tools and a read-only access profile. This is the autonomy ladder in practice: a team moves from level 1 to level 2 without skipping to level 3, and the agent earns increased access one step at a time. You decide which parts of the workflow keep a human in the loop, and you write that decision in configuration so an auditor can read it.
This lets a team introduce an agent into production operations gradually rather than all at once, without granting it authority to change production in the first step.
The guardrails are codified in code and configuration
Level 2 only holds if the limits hold at runtime. The first of dltHub’s verified agents, job-inspector, runs read-only. The job-inspector only has access to the pipeline telemetry, not to the destination data. The tools provided to these agents follow the access grant, so an agent without file access gets no file tools or shell, and never gets an MCP tool the grant doesn't cover. Credential values stay hidden from the agent. Each agent run has a cap on turns and tokens, so you can keep token spend under control.
You’ll bring your own model key for your organization's trusted LLM provider. Our verified agents are tested with Anthropic and OpenAI models.
Read-only access still leaves an agent plenty to work with: it can investigate why jobs fail. Let's look at an illustrative billing pipeline failure.
The source starts returning a decimal for total_amount, while the job expects an integer under its current schema contract. The load fails. An alert tells the engineer which job failed, but it leaves them to locate the relevant log lines and determine whether the problem originated in the source, the contract, or the pipeline code.
job-inspector begins when that failed job triggers it. Working from the run, the logs and the job definition, it reports the type mismatch, the step that rejected the value, and how confident it is that the cause is upstream data. The engineer then verifies the source payload and the contract before choosing a fix.
The background agent provides the root-cause analysis and a solution direction; the log evidence tells them whether to trust it. job-inspector prepares the case; the engineer makes the production decision.
dltHub background agents run on the primitives you already use
Agent jobs use the same primitives as the jobs you already run on dltHub: the deployment manifest, triggers, schedules, and the AI harness. Install the harness, declare job-inspector in your manifest next to the pipelines it should watch, and pick a trigger. The next failed job receives a diagnosis. If you have deployed a job on dltHub, you know most of what you need.
job-inspector ships as a verified template that you can adapt. Change its instructions, narrow it to the pipelines that matter, or write your own agent for the failure your team sees most often. An agent is a short Markdown file or a Python function, and any agent you write gets the same triggers, limits, and access rules as the ones dltHub ships.
How to get started
job-inspector is in public preview and available to all dltHub customers. Get started setting up your first background agent by pasting this prompt into Claude, Codex or Cursor. The agent installs or upgrades the dltHub AI harness and declares job-inspector next to the pipelines it should watch, deploying it with your workspace.
Add job-inspector to my workspace and run it when the load fails
Set up this directory for dltHub background agents. Use `uv run` and pass
`--non-interactive` to `dlthub` commands.

1. If there is no `.dlt/.workspace` file, run `uvx dlthub-init@latest`.
2. Add these dependencies to pyproject.toml and run `uv sync`:
   "dlt[hub]==1.31.0", "dlthub[mcp]", "dlthub-client>=0.28.7",
   "pydantic-ai-slim[anthropic,openai,google,mcp,spec]>=2.35.0", "aiohttp>=3.14.3"
3. Run `uv run dlthub ai toolkit install dlthub-platform --overwrite`, then
   `uv run dlthub ai status`, and fix any warnings.
4. Declare the `job-inspector` agent in `__deployment__.py`.
   Trigger `job-inspector` on the jobs I choose, never the default `job.fail:*`.
   Ask me which jobs to watch, or which pipeline to build first if there are none.

I'll configure the model key and endpoint myself. Never ask for them, put them
in a command, or write them to a file.
Read the docs, follow the agents section of the agentic data engineering course when it lands, or reach out and the dltHub team will onboard you.
Frequently asked questions
Does job-inspector fix the pipeline?
No. It classifies the failure, states its confidence, and lists the evidence, and you apply the fix. Proposed fixes with human approval are the next level on the autonomy ladder.
What can it read?
By default, it reads workspace code and configuration, the AI harness, pipeline traces and logs, and the dataset schema. It never reads secrets, and you can narrow its access further in its configuration.
Which models run it, and can they see my data?
In the public preview, you bring your own key, and the agents are tested with Anthropic and OpenAI models. The agent reads only what its access grant covers.
Which agent loop does it run on?
dltHub runs on Pydantic AI, a model-agnostic agent loop.