Release highlights: 0.26
Released August 24, 2026, with dlthub-client 0.28.2. This release makes setting up a pipeline a guided flow, moves every settings surface into one place, and adds an interactive schema graph for exploring what a pipeline loaded.
Guided pipeline setup
A new Add a pipeline page takes you from scaffolding a source locally to a deployed, scheduled pipeline in five guided steps. It's now the empty state for a workspace, so a new workspace opens straight into it.

Each step that a coding agent can do for you carries an agent-prompt panel that generates a copy-ready prompt for Claude, Codex, or Cursor. Steps that handle credentials stay manual, so secrets never leave your machine. The final step includes a trigger picker that turns the schedule you choose into the exact trigger expression.

All settings in one place
Centralized settings is now the only settings surface. Every entry point opens it, and clicking Settings lands you on the workspace General section.
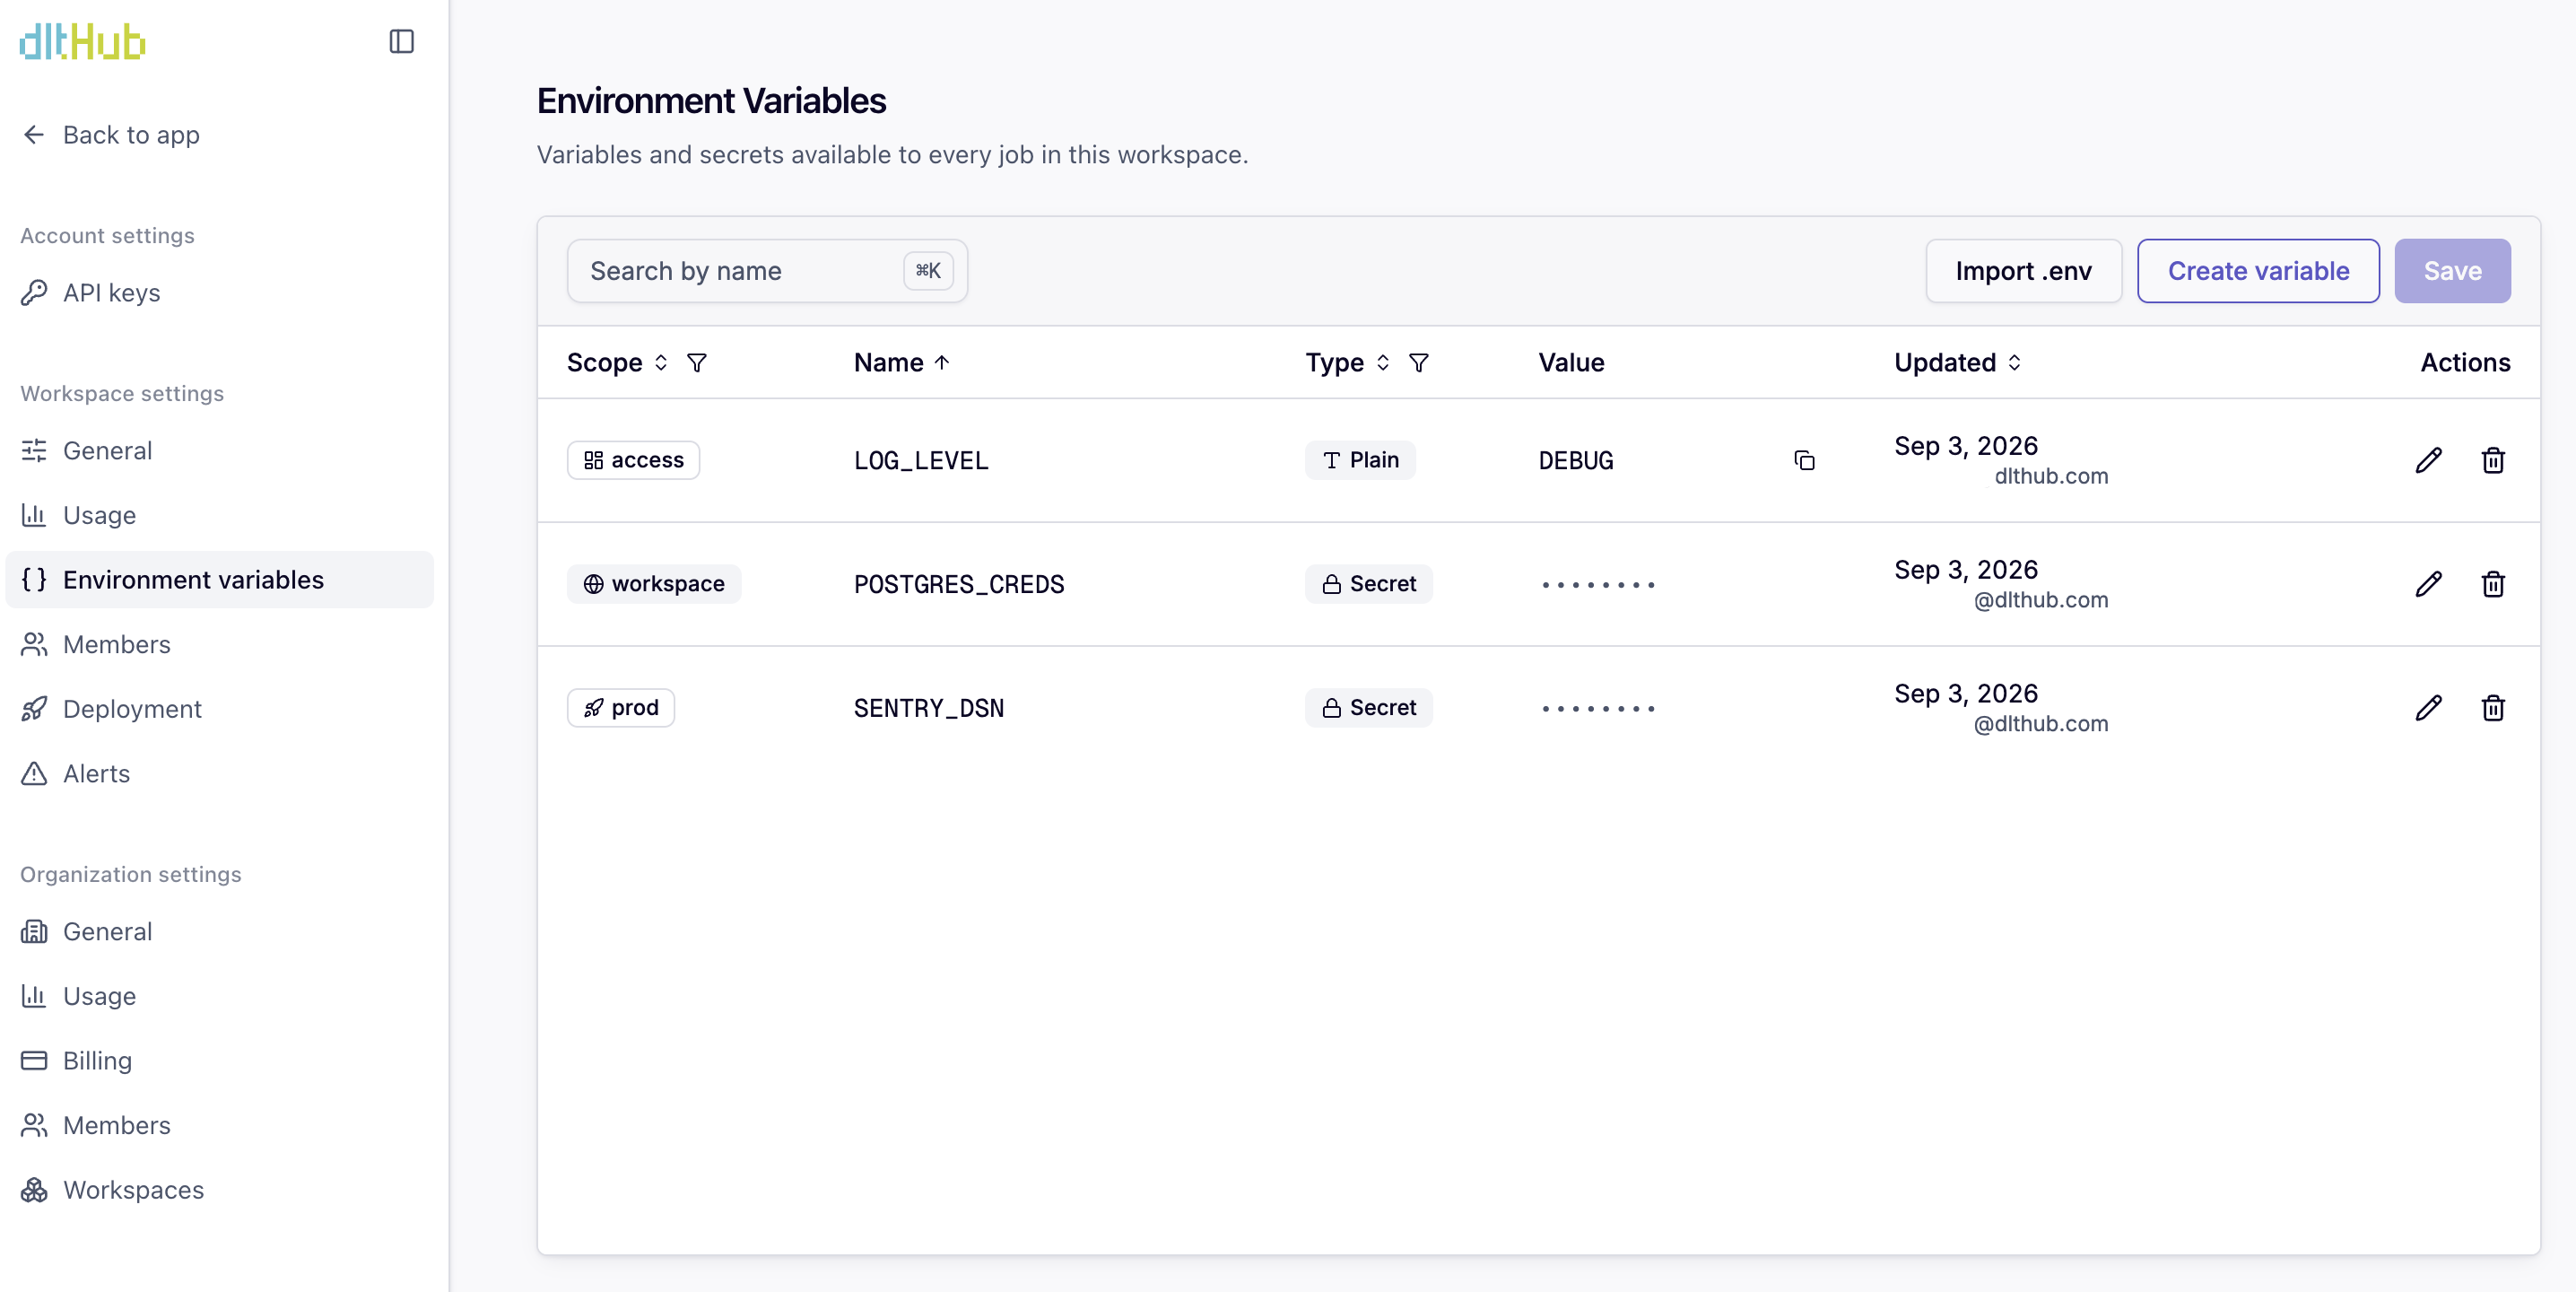
Environment variables now live there too. Workspace and organization owners can read and edit workspace variables and secrets without leaving settings. Everyone else sees a note explaining that the section is owner-only.
The organization workspaces table now shows who owns each workspace and how many people are in it, with the member count linking straight to that workspace's members. Playground workspaces carry a badge and show "Just you".
See Settings for the full reference.
An interactive schema graph
Dataset and pipeline run pages gained an interactive schema graph. Table cards show columns, keys, per-table traffic, and load status, laid out in dependency columns with relationship edges anchored on the exact foreign-key columns. A table that failed to load gets a red border, with the error in its tooltip.
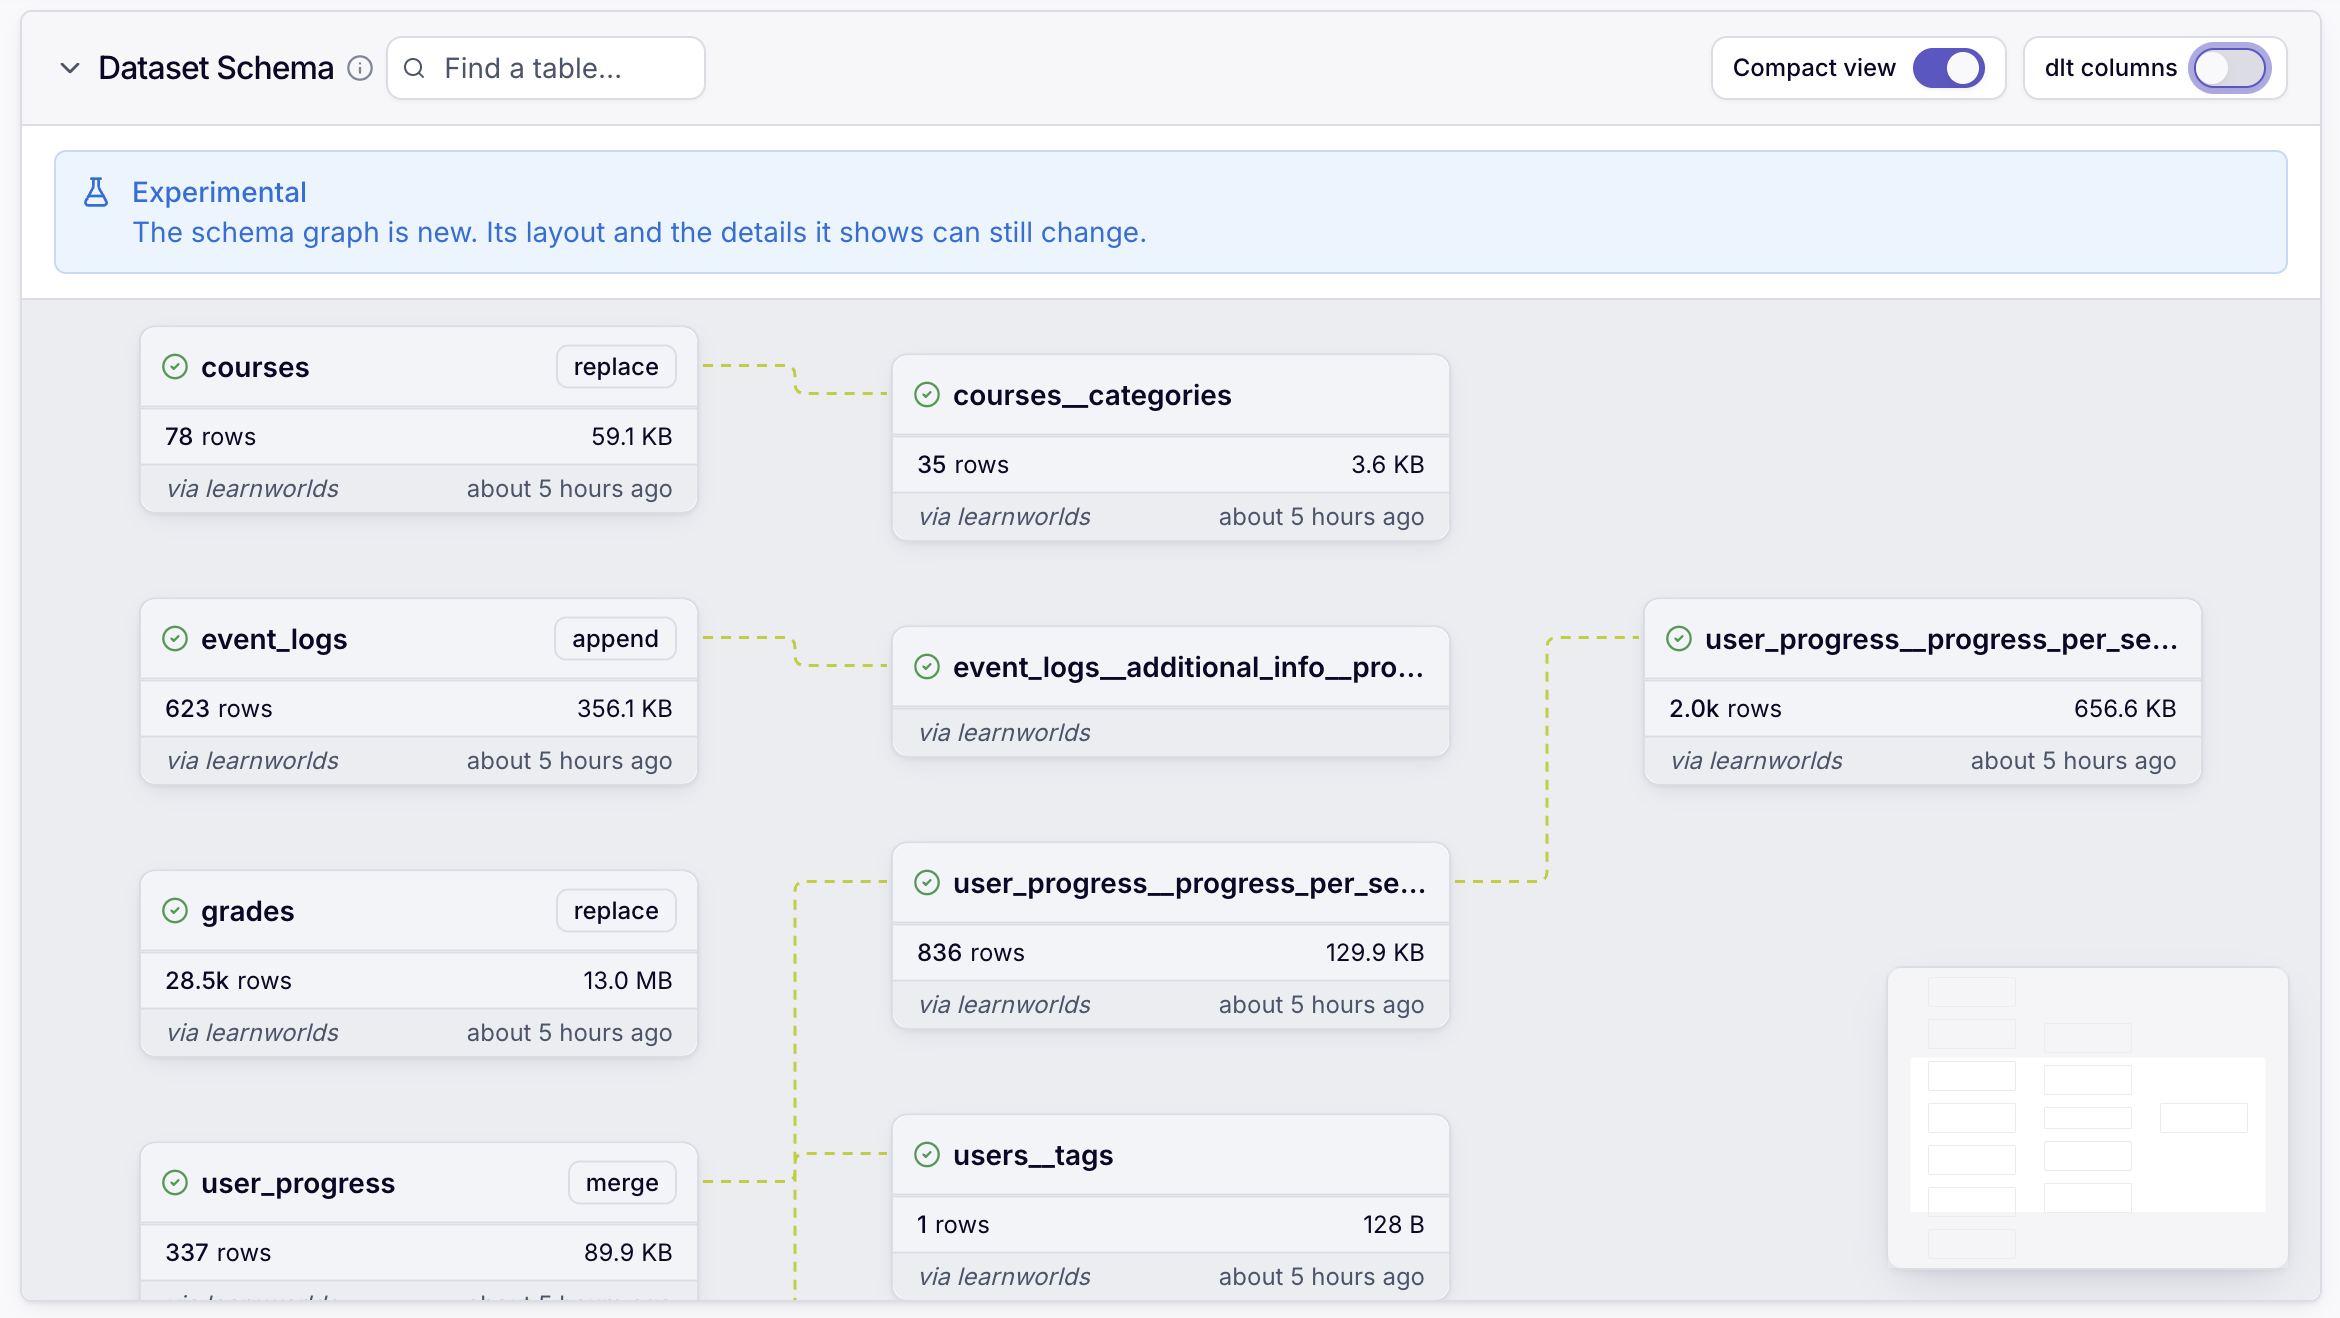
The graph reads cross-table foreign keys from dlt's references hints, so relationships you declare in your schema show up as edges. Compact view, shown here, trades the column lists for a denser overview of the whole dataset.
The schema graph ships as a collapsed experimental section. Expand it on any dataset or pipeline run page to try it.
Rows now counts rows loaded
The Rows figure shown across the app now reports rows loaded into the destination rather than rows extracted. It's the more meaningful number, and it matches how the rest of the platform's telemetry reports.
Notebooks are now Data Apps
"Notebooks" is called Data Apps throughout the app: sidebar, breadcrumbs, interactive script cards, shared public-link headers, and the public run frame. Existing links keep working and the route path is unchanged, so nothing you have bookmarked or shared breaks. See Build a marimo notebook.
Smaller improvements
- Data tables gained clickable cells, row hover highlighting, and clickable history bars, so individual values and bars can navigate.
- List empty states now say which time range they cover.
- The add-pipeline stepper advances when you mark a manual step done.
- Row actions no longer show a shared pending state across rows.
For API consumers
The jobs list endpoint, named scripts in the API, takes an opt-in include_recent_runs parameter. When set, each job comes back with its most recent runs, including status, duration, start time, and rows loaded, in a single request. It's off by default, so existing callers are unaffected.