Internal Dashboard for Google Analytics 4
 Rahul Joshi,
Jr. Solutions Engineer
Why GA4?
We set out to build an internal dashboard demo based on data from Google Analytics (GA4). Google announced that they will stop processing hits for Universal Analytics (UA) on July 1st, 2023, so many people are now having to figure out how to set up analytics on top of GA4 instead of UA and struggling to do so. For example, in UA, a session represents the period of time that a user is actively engaged on your site, while in GA4, a session_start event generates a session ID that is associated with all future events during the session. Our hope is that this demo helps you begin this transition!
Initial explorations
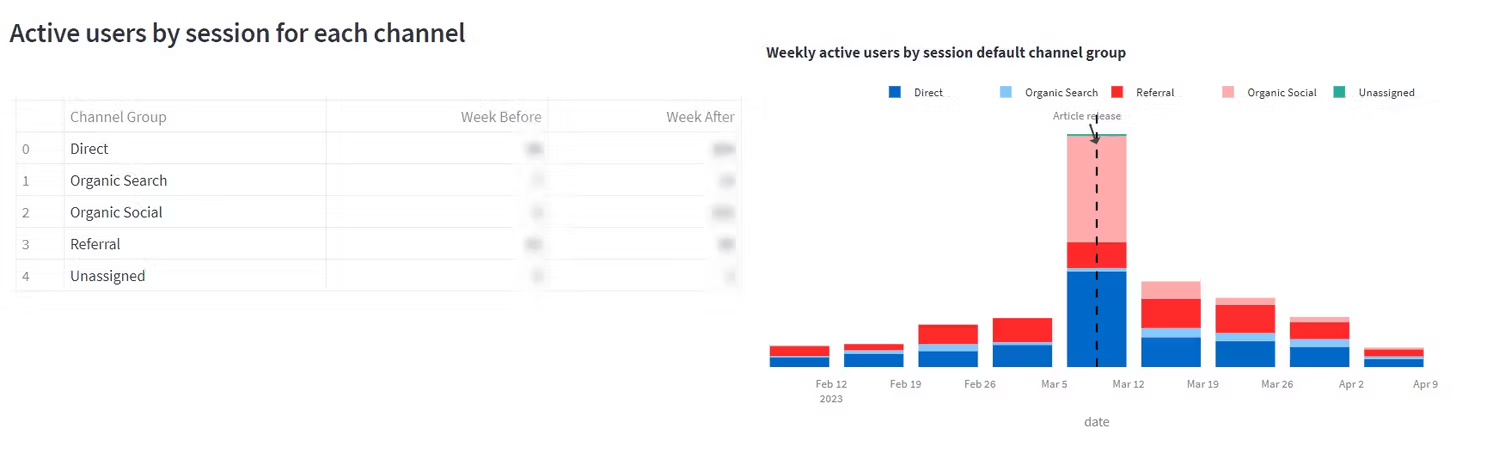
We decided to make a dashboard that helps us better understand data attribution for our blog posts (e.g. As DuckDB crosses 1M downloads / month, what do its users do?). Once we got our credentials working, we then used the GA4 dlt pipeline to load data into a DuckDB instance on our laptop. This allowed us to figure out what requests we needed to make to get the necessary data to show the impact of each blog post (e.g. across different channels, what was the subsequent engagement with our docs, etc). We founded it helpful to use GA4 Query Explorer for this.

With the data loaded locally, we were able to build the dashboard on our system using Streamlit. You can also do this on your system by simply cloning this repo and following the steps listed here.
After having the pipeline and the dashboard set up just how we liked it, we were now ready to deploy it.
Deploying the data warehouse
We decided to deploy our Streamlit app on a Google Cloud VM instance. This means that instead of storing the data locally, it would need to be in a location that could be accessed by the Streamlit app. Hence we decided to load the data onto a PostgreSQL database in the VM. See here for more details on our process.
Deploying the dlt pipeline with GitHub Actions
Once we had our data warehouse set up, we were ready to deploy the pipeline. We then followed the deploy a pipeline walkthrough to configure and deploy a pipeline that will load the data daily onto our data warehouse.
Deploying the dashboard
We finally deployed our Streamlit app on our Google Cloud VM instance by following these steps.