Explore your data with marimo
For an agent-driven workflow, see the dltHub AI workbench data exploration toolkit — a set of context files and prompts for generating marimo notebooks from your dlt datasets with a coding agent.
marimo is a reactive Python notebook. It completely revamps the Jupyter notebook experience. Whenever code is executed or you interact with a UI element, dependent cells are re-executed ensuring consistency between code and displayed outputs.
This page shows how dlt + marimo + ibis provide a rich environment to explore loaded data, write data transformations, and create data applications.
Prerequisites
Install the required dependencies:
pip install marimo ibis-framework mowidgets duckdb
Launch marimo
Use this command to launch marimo (replace my_notebook.py with desired name). It will print a link to access the notebook web app.
marimo edit my_notebook.py

> Edit my_notebook.py in your browser 📝
>   ➜  URL: http://localhost:2718?access_token=Qfo_Hj2RbXqiqM4VT3XOwA
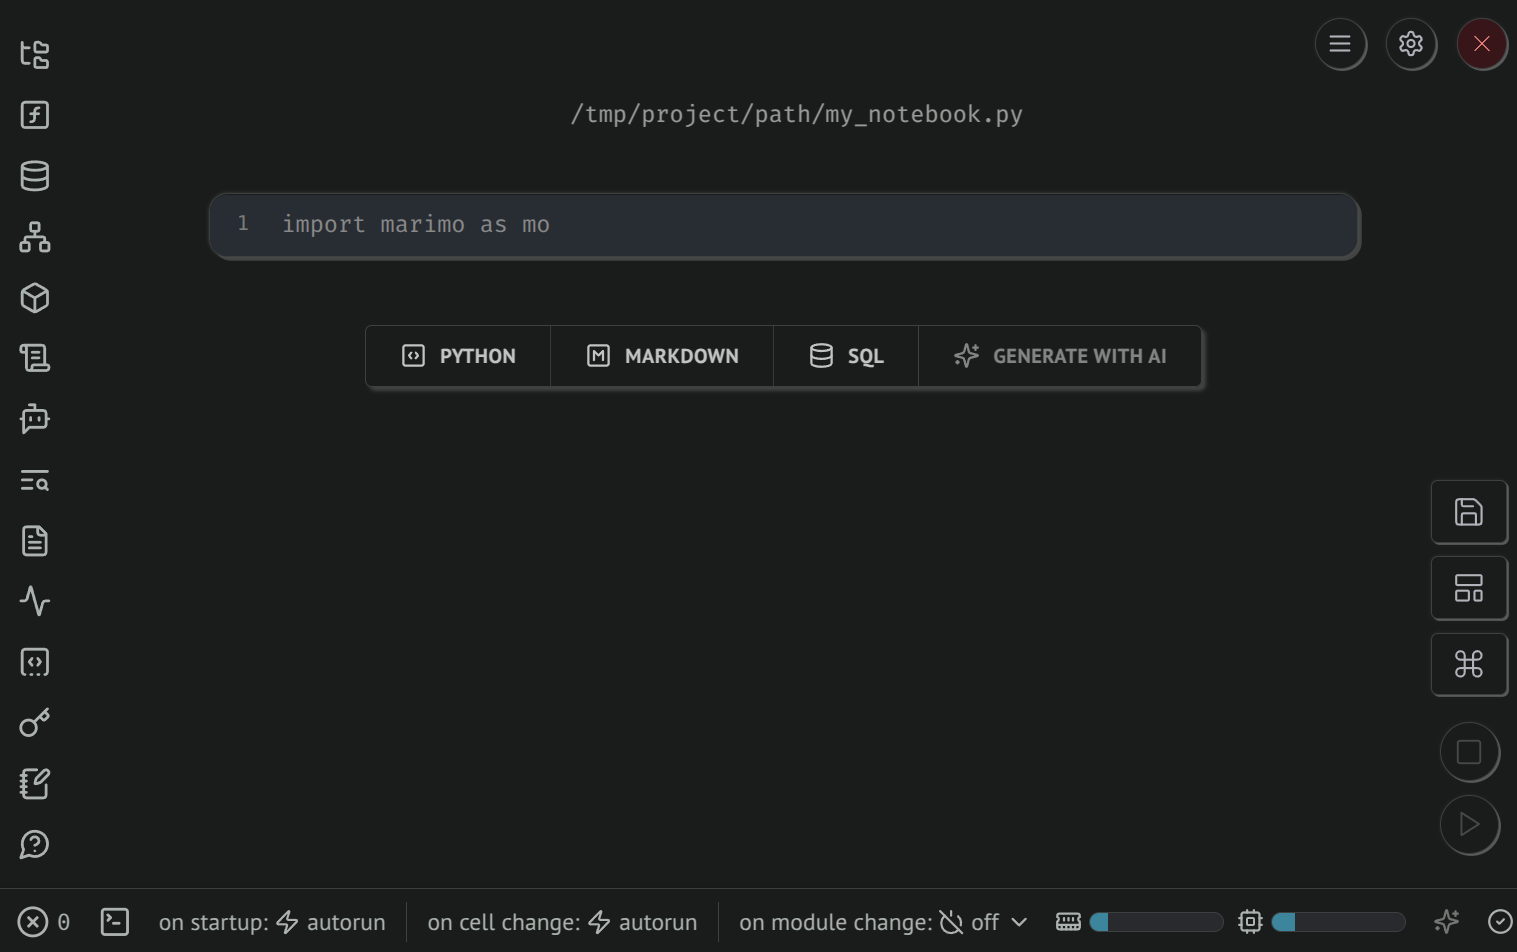
Here's a screenshot of the interface you should see:
To run an existing local marimo notebook:
marimo run my_notebook.py
Features
Use custom dlt widgets
Inside your marimo notebook, you can use composable widgets built and maintained by the dlt team. This requires the mowidgets package (Python 3.11+).
Import them from dlt.helpers.marimo and pass them to the render() function:
#%% cell 1
from dlt.helpers.marimo import render, load_package_viewer, pipeline_selector

#%% cell 2
render(pipeline_selector)

#%% cell 3
render(load_package_viewer, pipeline_path="/path/to/pipeline")
Available widgets: pipeline_selector, load_package_viewer, schema_viewer.

View dataset tables and columns
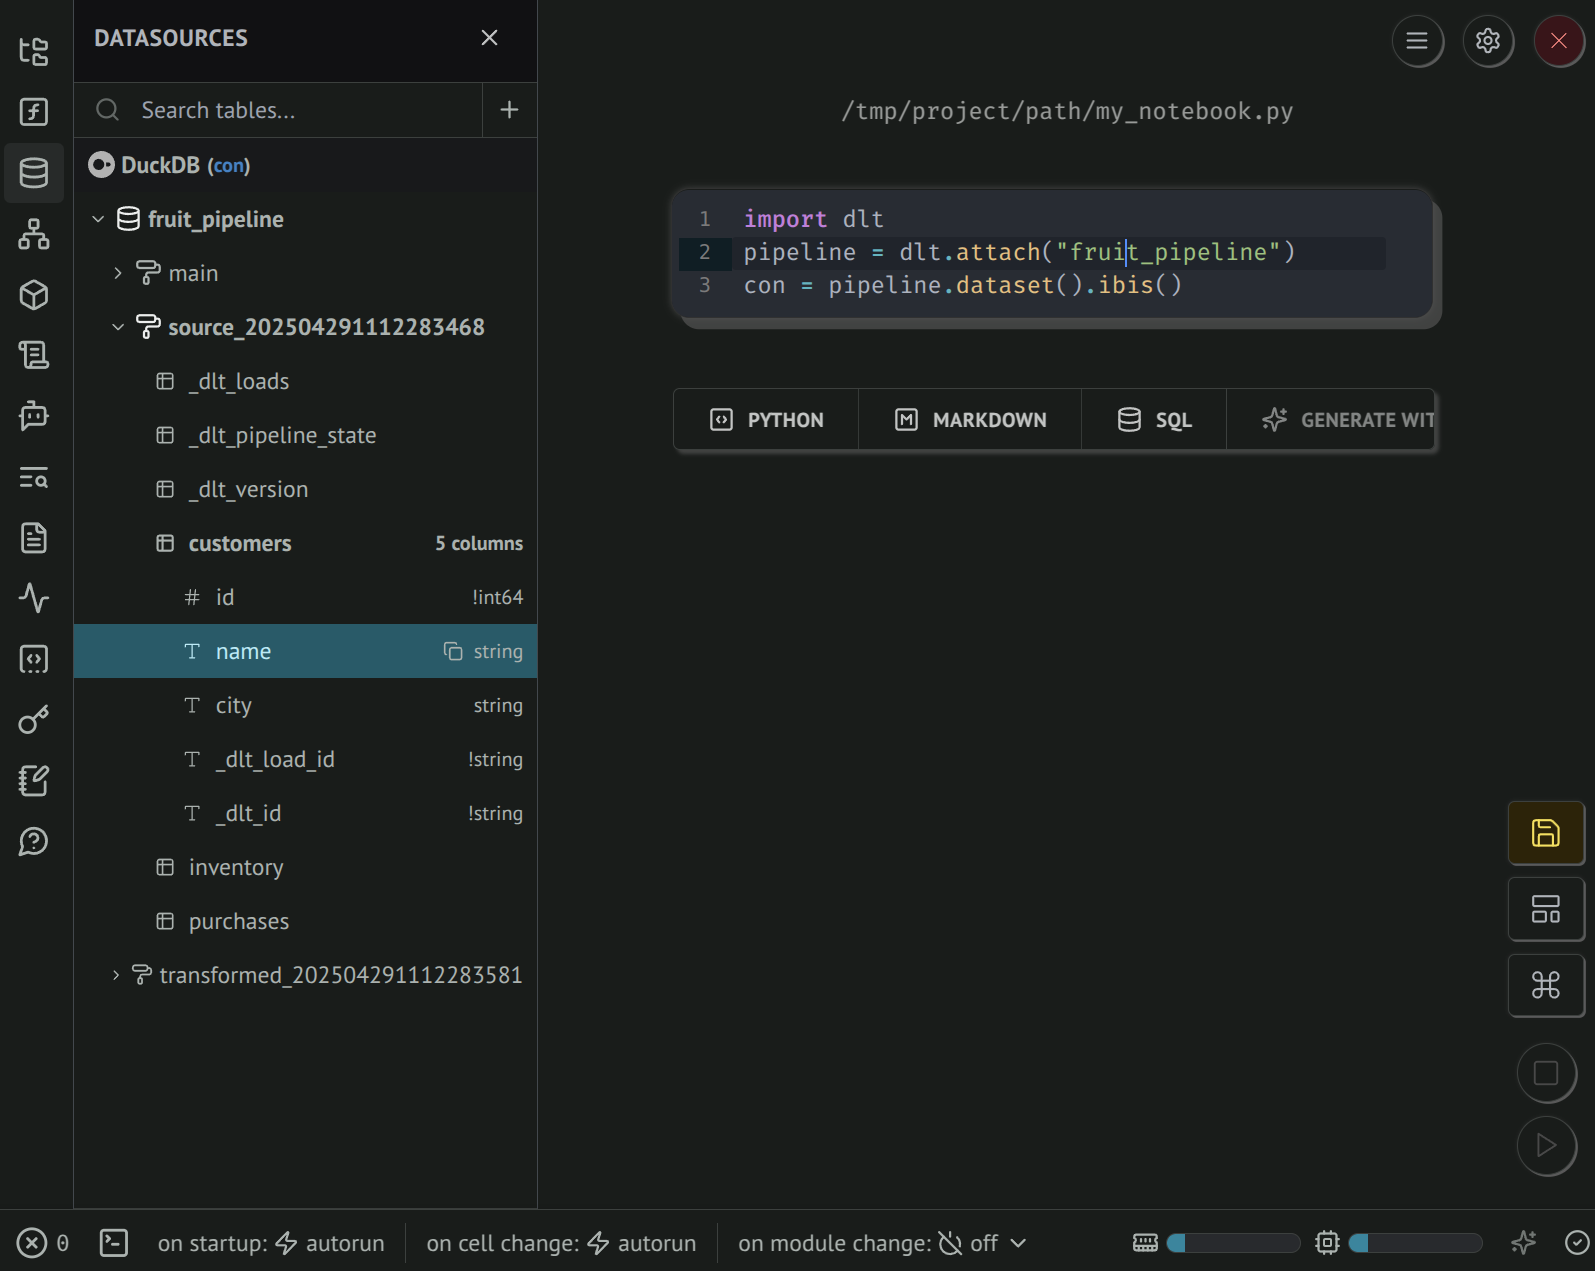
After loading data with dlt, you can access it via the dataset interface, including a native ibis connection.
In marimo, the Datasources panel provides a GUI to explore data tables and columns. When a cell contains a variable that's an ibis connection, it is automatically registered.
Accessing data with SQL
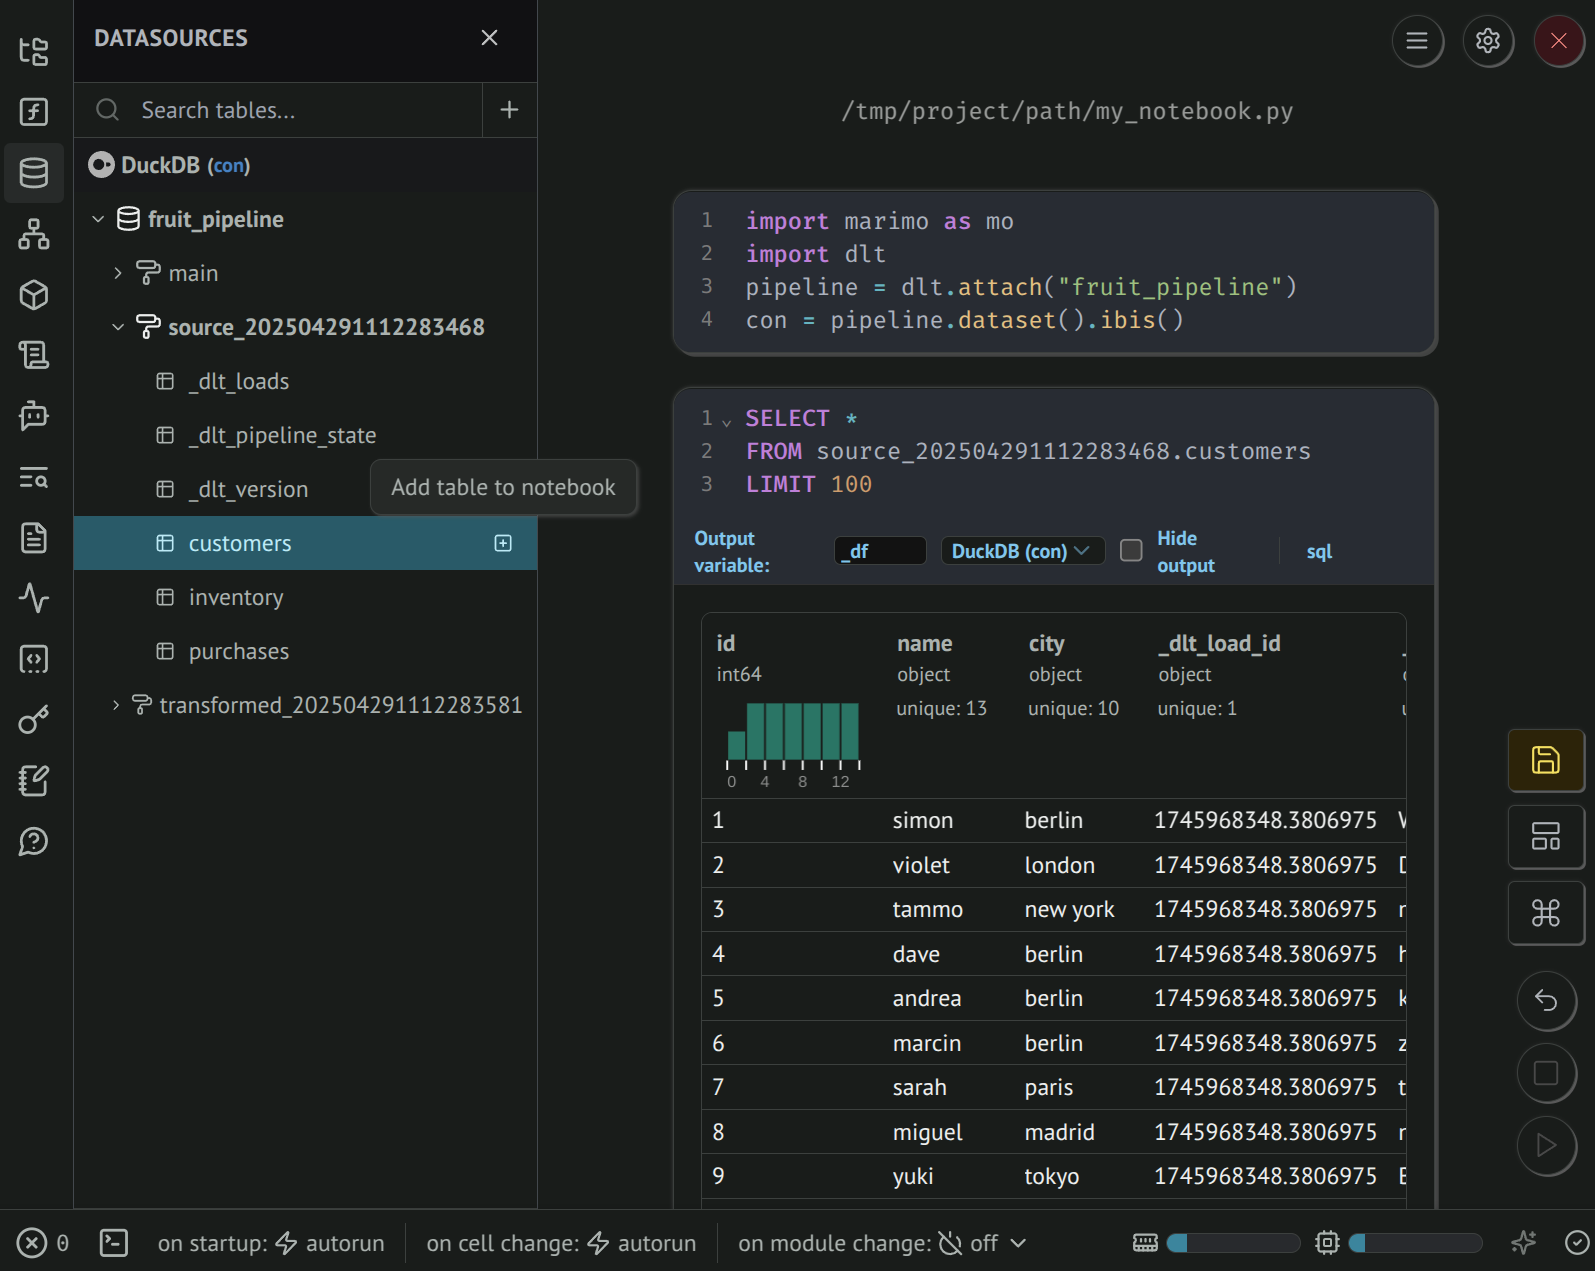
Clicking on the Add table to notebook button will create a new SQL cell that you can use to query data. The output cell provides a rich and interactive results dataframe.
The Datasources displays a limited range of data types.
Accessing data with Python
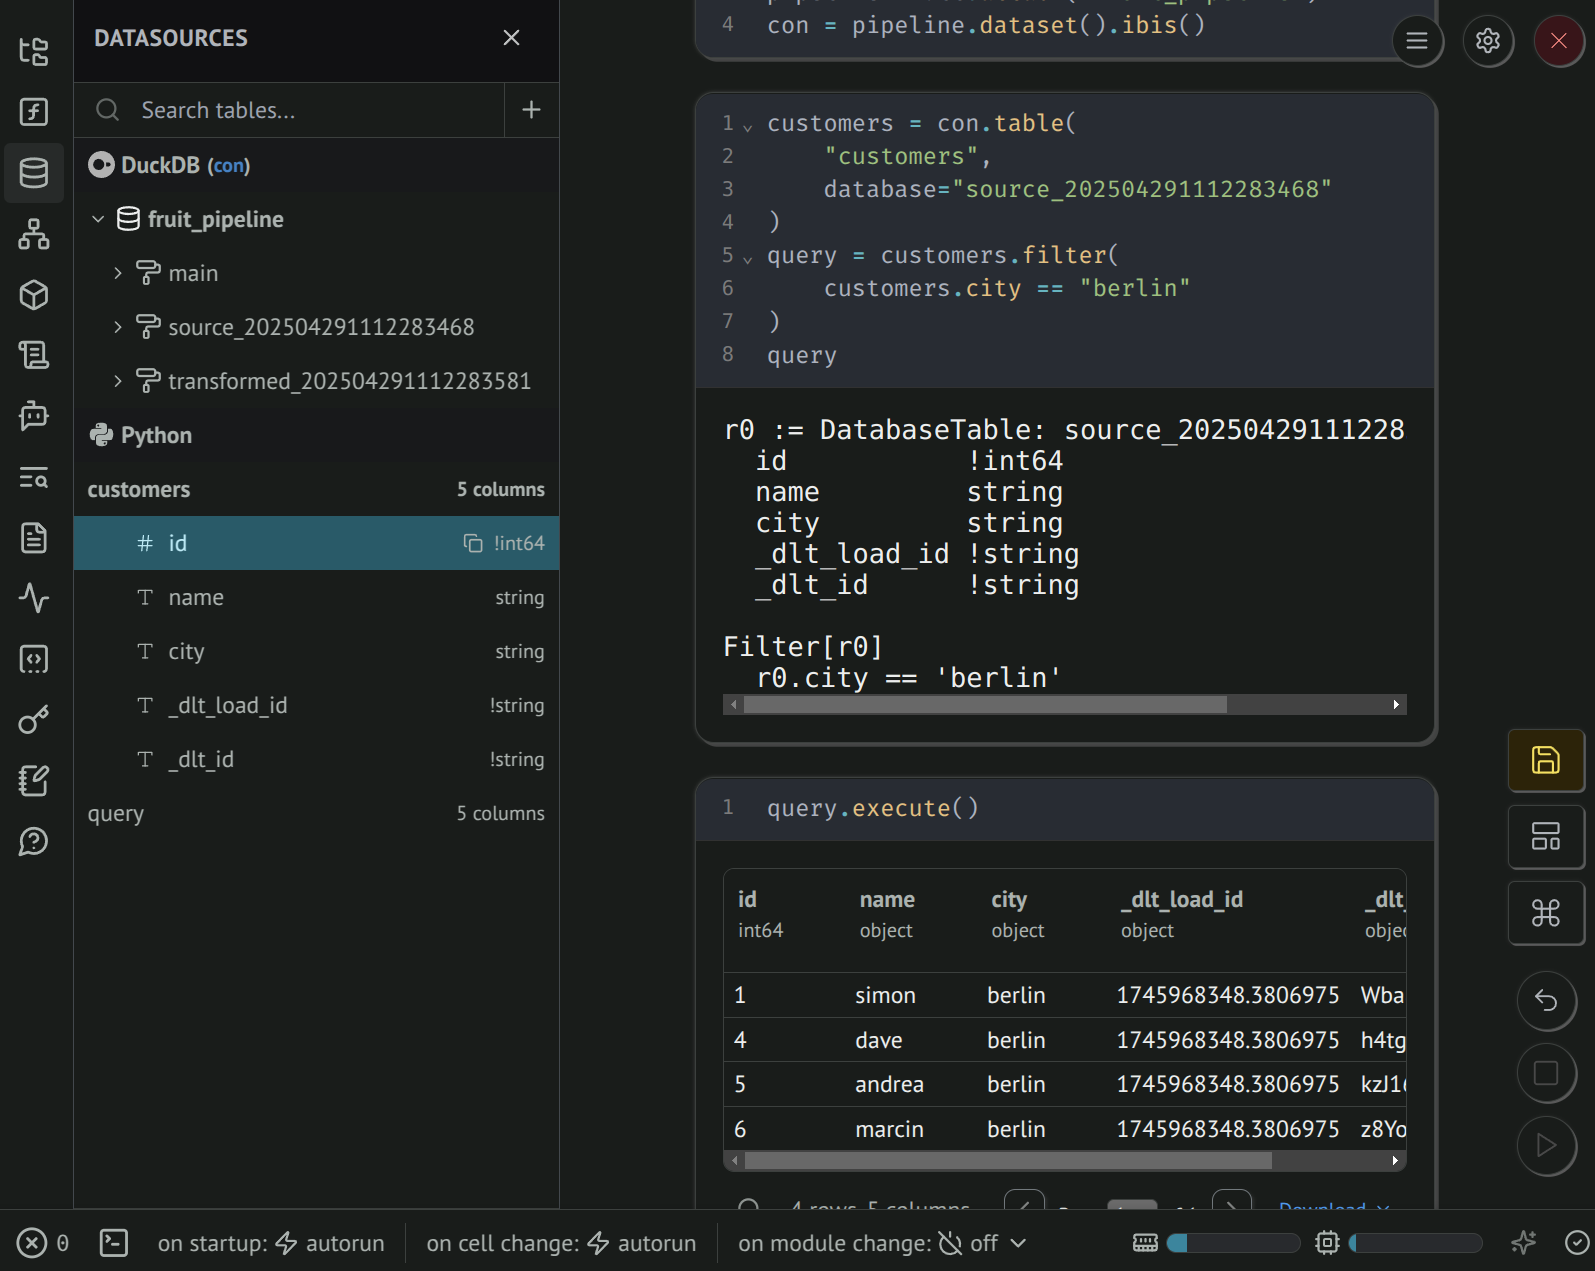
You can also retrieve Ibis tables (lazy expressions) using Python. The Datasources panel will show under Python the output schema of your Ibis query, and the cell output will display detailed query planning.
Use .execute(), .to_pandas(), .to_polars(), or .to_pyarrow() to execute the Ibis expression and retrieve data that can displayed in a rich and interactive dataframe.
The Datasources displays a limited range of data types.
Create a dashboard and data apps
Marimo notebooks can also be deployed as web applications with interactive UI and charts and the code hidden. Try adding marimo UI input elements, rich markdown, and charts (matplotlib, plotly, altair, etc.). Combined, dlt + marimo + ibis make it easy to build a simple dashboard on top of fresh data.